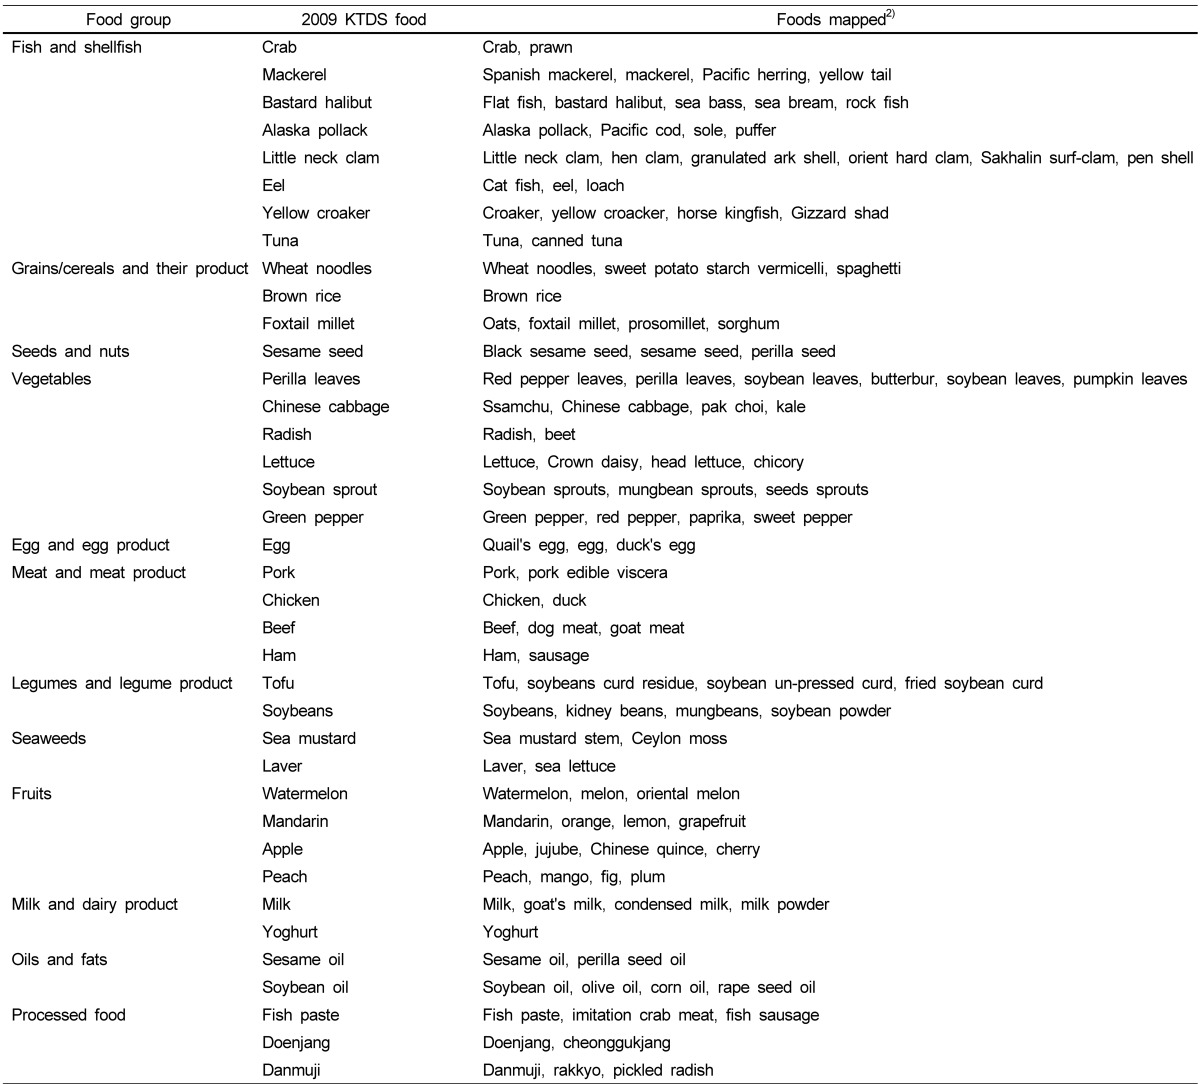
Table 1.
Examples of food mapping for the dietary exposure estimates1)
1)Foods reported as consumed in the 2007 KNHANES were matched to the 114 representative foods selected in the 2009 KTDS.
2)Foods other than these 114 food items in the representative food list are mapped to the latter by similarity in order to secure appropriate metal levels when estimating total dietary exposure to heavy metals.

