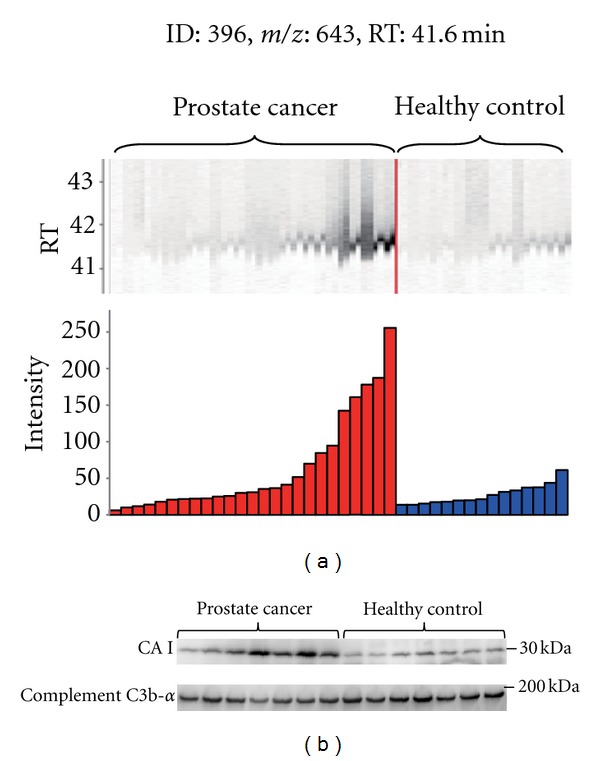
Figure 2.

(a) MS peaks of peak ID 396 in triplicate LC-MS runs (25 with prostate cancer (left) and 15 with healthy controls (right)) aligned along LC RT. Columns represent the mean intensities of triplicate runs. (b) Immunoblotting of CAI and complement C3b-α (loading control) for 7 prostate cancer patients selected from the most intense MS peaks and 7 healthy controls from the least intense peaks.
