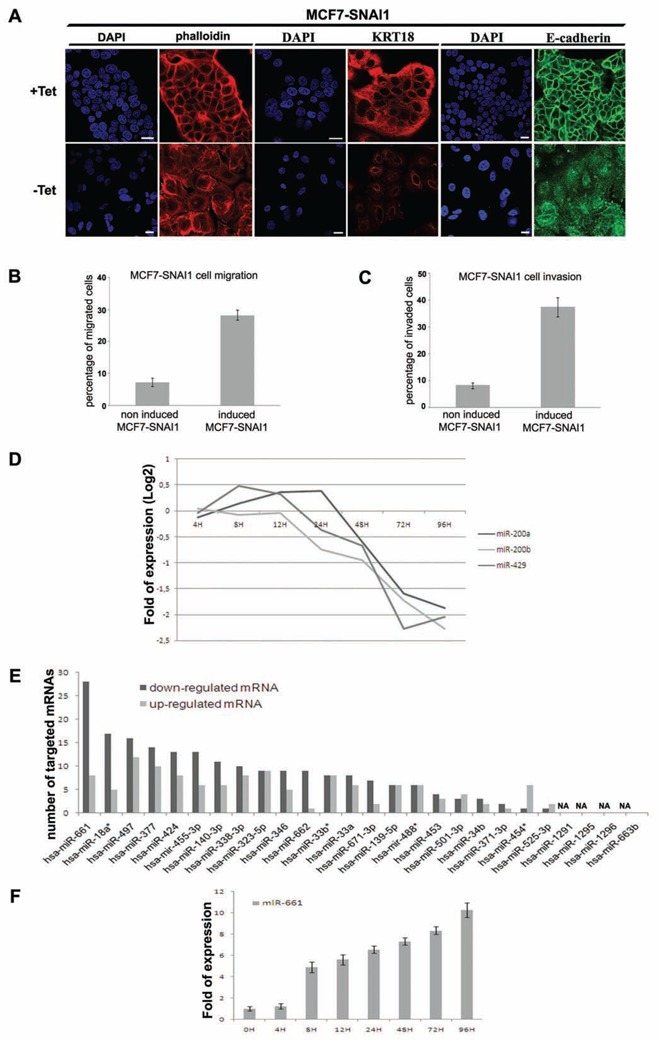
Figure 1. Time resolved transcriptomic analysis of early miRNAs during EMT in inducible MCF7 cells expressing SNAI1.

(A), Immunofluorescence and DAPI staining realized with Texas Red phalloidin, specific anti-Cytokeratin-18 (KRT18) and anti-E-Cadherin antibodies in non-induced and 48 h induced MCF7-SNAI1 cells. White bar, 20 μm. SNAI1 induction in MCF7-SNAI1 cells was obtained by removing Tetracycline from the culture media (represented in figures by −Tet), conversely the presence of tetracycline repressed SNAI1 expression (represented in figures by +Tet). (B) (C), Evaluation of the MCF7-SNAI1 cell motility after 24 h SNAI1 induction using uncoated Transwells for cell migration (B) or Matrigel-coated Transwells for cell invasion (C). (D), Detection of expression of miR-200a, miR-200b and miR-429 by miRNA-microarrays in MCF7-SNAI1 cells at different time points after SNAI1 induction. (E), Evaluation of the number of mRNAs predicted to be targeted by each miRNA found to be up-regulated at a time point preceding 12 h after SNAI1 induction. mRNAs that were found previously to be up-or down-regulated after SNAI1 induction (Vetter et al., 2009) were selected for this analysis. miRbase software (version 13) was used for the target prediction using a minimal score of 17. NA, means prediction Non Available. (F), Quantitative Real-time PCR analyses of miR-661 expression realized in MCF7-SNAI1 cells at different time points after SNAI1 induction. Results are represented as the mean +/− s.e.m (standard error of mean) of at least 3 independent experiments.
