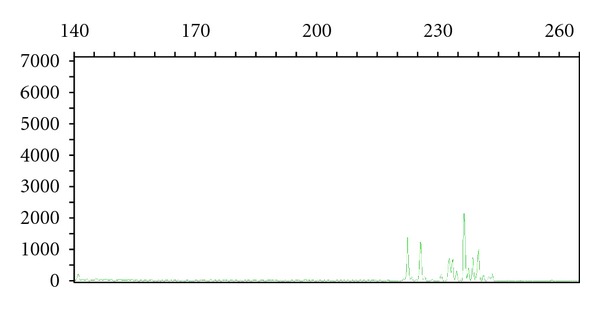
Figure 3.

Capillary electropherogram of TRG@ PCR study. Oligoclonal rearrangements using Vγ1-8 primers. Note the presence of multiple irregular peaks in a nonGaussian distribution. The X axis is amplicon size (base pairs) and the Y axis is random fluorescent units.
