

Abstract
The cardiopulmonary exercise test (CPET) is an important physiological investigation that can aid clinicians in their evaluation of exercise intolerance and dyspnea. Maximal oxygen consumption () is the gold-standard measure of aerobic fitness and is determined by the variables that define oxygen delivery in the Fick equation ( = cardiac output × arterial-venous O2 content difference). In healthy subjects, of the variables involved in oxygen delivery, it is the limitations of the cardiovascular system that are most responsible for limiting exercise, as ventilation and gas exchange are sufficient to maintain arterial O2 content up to peak exercise. Patients with lung disease can develop a pulmonary limitation to exercise which can contribute to exercise intolerance and dyspnea. In these patients, ventilation may be insufficient for metabolic demand, as demonstrated by an inadequate breathing reserve, expiratory flow limitation, dynamic hyperinflation, and/or retention of arterial CO2. Lung disease patients can also develop gas exchange impairments with exercise as demonstrated by an increased alveolar-to-arterial O2 pressure difference. CPET testing data, when combined with other clinical/investigation studies, can provide the clinician with an objective method to evaluate cardiopulmonary physiology and determination of exercise intolerance.
1. Introduction
The cardiopulmonary exercise test (CPET) is an important physiological investigation that can aid clinicians in their diagnostic evaluation of exercise intolerance and dyspnea [1, 2]. Although cardiac and pulmonary etiologies are the most common causes for dyspnea and exercise intolerance [3, 4], neurological, metabolic, hematologic, endocrine, and psychiatric disorders can all contribute. The data gathered from a CPET can provide valuable information to differentiate between these causes [5], as progressive incremental exercise testing provides the most comprehensive and objective assessment of functional impairment and yields information about the metabolic, cardiovascular, and ventilatory responses to exercise. In addition to assisting in the diagnosis of dyspnea and exercise intolerance, CPETs can be used for a broad range of other applications such as determining disease severity, exercise prescription for rehabilitation, assessing the effectiveness of pharmacological agents, or in the assessment for lung transplant (see Table 1).
Table 1.
Indications for cardiopulmonary exercise testing.
| Assessment of unexplained dyspnea | |
| Evaluation of disease severity | |
| Development of an exercise prescription for pulmonary | |
| rehabilitation | |
| Identification of gas exchange abnormalities | |
| Preoperative assessment: | |
| Lung cancer surgery | |
| Lung volume reduction surgery | |
| Heart or lung transplantation | |
| Evaluation for lung/heart transplantation | |
| Objective evaluation of exercise capacity |
Algorithms exist to help identify CPET patterns of known clinical diagnosis [6], and typical clinical responses have been detailed previously [1]. However, in order for clinicians to interpret CPET results, a thorough understanding of the cardiopulmonary responses to exercise is needed. The purpose of this paper is to provide the clinician with an overview of the physiological responses to exercise as well as the processes used to evaluate the mechanism(s) for exercise intolerance.
2. Cardiovascular Response to Exercise
Maximal oxygen consumption () is a measure of the capacity for aerobic, and exercise is determined by the variables found in the Fick equation:
| (1) |
where Q is the cardiac output (the product of heart rate and stroke volume) and CaO2 and CvO2 are the O2 contents of arterial and mixed venous blood, respectively. From this equation, it is evident that the factors that influence would include cardiac function, oxygen carrying capacity, and the ability of the tissues to extract oxygen.
In healthy subjects, of the variables involved in oxygen delivery, it is the limitations of the cardiovascular system that are most responsible for limiting [7]. Ventilation and gas exchange are usually sufficient to maintain arterial PO2 (PaO2), and therefore arterial saturation (SaO2) and CaO2 are also maintained up to maximal workload [8]. Numerous studies have shown that can be increased through exercise training [9, 10]. While peripheral adaptation occurs with training that will increase peripheral O2 extraction [11], the primary mechanism for training-induced improvements in is an increase in cardiac output secondary to an augmented stroke volume response to exercise [12]. Indeed, many studies have shown positive cardiac adaptation with exercise training [13–17]. The increased stroke volume response with exercise results in a reduced submaximal heart rate with exercise training; however, peak heart rate is generally unaffected by training [12]. Experimental studies have demonstrated that improvements in O2 delivery will positively affect . As an example, Stray-Gundersen et al. showed that both peak cardiac output and could be increased by 20% in untrained dogs by performing pericardiectomy [18]. This effect is due to increased ventricular filling and thus an increased cardiac output. Conversely, a reduction in peak cardiac output will lead to a lower . This is highlighted by studies in normal humans showing beta blockade reduces by decreasing both maximal heart rate and stroke volume [19]. These examples from experimental studies demonstrate the close link between peak cardiac output and in health.
As increases with incremental exercise, the variables in the Fick equation will eventually reach their upper limits, and as a result, a plateau of the will occur. The plateau in oxygen consumption despite an increase in workload is defined as a person's . However, many subjects, particularly clinical patients, do not demonstrate this plateau in [20], for a variety of reasons which may include intolerable symptoms of breathing discomfort (dyspnea), muscular fatigue, chest pain, and so forth, [20, 21]. If a plateau is not seen, then the highest V O2 achieved, termed the , is used as an estimate of [20, 22]. These values represent the maximal oxygen consumption and can be expressed in L/min or indexed by body weight and expressed in mL/min/kg [20]. Of note, the best adjustment for body size is not known and many estimations exist [20]. Various reference equations have been provided (see [1] for list) to evaluate , and previous guidelines [1] define a of predicted as low and abnormal (see later section on evaluating for further discussion).
The limitation of the cardiovascular system is well accepted as being the point where healthy subjects reach their [23, 24]. Thus, if a subject reaches their maximum predicted heart rate (HR) for age (i.e., peak HR > 85% of predicted [1]), it would be reasonable to conclude based on the cardiac response that they have reached their . However, this should not be used as a single determinant of , as there is considerable between-subject variability in maximal heart rate [25]. As well, clinical conditions and medications, especially beta blocker use, can affect the HR response to exercise [20–22]. Thus, in the setting of a reduced , (i.e., <85% of predicted [1]), reaching maximal HR suggests maximal subject effort and that a cardiac limitation may exist; however, this must be confirmed by examining additional variables (see later section).
Oxygen pulse is the amount of oxygen consumed by the tissue per heart beat (i.e., /heart rate) [26]. By modifying the variables in the Fick equation, the O2 pulse is calculated as follows:
| (2) |
With O2 pulse, the assumption is that the a − v O2 difference widens in a predictable manner, and therefore examination of the O2 pulse can provide information about the stroke volume response to exercise [26]. In the setting of a low , a reduced O2 pulse would indicate a low stroke volume response to exercise. However, as O2 pulse is calculated using HR, the value is subject to the same assumptions regarding the HR response to exercise, and therefore the considerable between-subject variability in maximal heart rate [25] can translate to substantial variability in O2 pulse response to exercise.
In summary, the is determined by the variables that define oxygen delivery by the Fick equation. While anything that alters components of the Fick equation can alter , studies in health have demonstrated that it is the cardiac output response and more specifically the stroke volume response to exercise that limit , and thus in the normal healthy subject, is limited by the cardiovascular system.
3. Ventilatory Response to Exercise
As previously mentioned, increases during exercise as governed, by the Fick equation. With increasing O2 consumption there is an increase in CO2 production (). The relationship between PaCO2, , and alveolar ventilation () is governed by the alveolar ventilation equation [27]:
| (3) |
PaCO2 is reported in mmHg (and assumed to be equal to alveolar PCO2), while both and are reported in L/min [28]. is always given at 0°C, 760 mmHg, dry (STPD); and PaCO2 are reported under body temperature, ambient pressure and saturated with water vapor (BTPS) [28]. The K is a conversion factor [(273 + t) × 760/273], where t = body temperature (273 is 0°C converted to °Kelvin). K is used to adjust to body temperature and pressure and is equal to 863 mmHg at sea level and at normal body temperature of 37°C [27, 29]. As highlighted in (4) in the following section, can be derived from (minute ventilation) and (physiologic dead space ventilation).
Assuming K does not change with exercise, (3) demonstrates that in order to maintain PaCO2 at normal resting values, must increase with exercise because of the increased CO2 production. Thus in health, the normal response from rest to mild/moderate exercise is an increase in ventilation that is commensurate with metabolic demand (termed exercise hyperpnea), and therefore PaCO2 should be unchanged from rest to mild/moderate exercise. Practically, subjects often hyperventilate prior to exercise (or at low levels of exercise in the laboratory), and therefore it is common to see PaCO2 rise to a more normal value with mild/moderate exercise. Once past ventilatory threshold, increases disproportionally relative to metabolic demand and PaCO2 drops below resting values (i.e., hyperventilation). PaCO2 typically falls to 30–35 mmHg at peak exercise, and a peak PaCO2 of 35–38 mmHg indicates a borderline effective alveolar hyperventilation, while a PaCO2 in excess of 38 mmHg suggests the absence of a compensatory hyperventilatory response [30]. Thus, PaCO2 values obtained with incremental exercise allow for the determination of the adequacy or appropriateness of ventilation during exercise.
End-tidal CO2 (PETCO2) can be used to estimate PaCO2. At rest PETCO2 is less than PaCO2 (and correspondingly end-tidal O2, PETO2 more than alveolar PO2, PAO2) due to dilution of gas from poorly perfused alveoli (i.e., dead space). Using end-tidal values to predict alveolar pressures has the potential of underestimating PaCO2; however, in the healthy lung at rest, dead space is extremely low, and PETCO2 is a good approximation of PaCO2 [28]. With exercise there is an increase in tidal volume (V T), and mixed venous CO2, such that the within-breath fluctuations of alveolar gas composition are greater [31]. With the rapid increase in alveolar volume on inspiration during exercise, end-inspiratory PCO2 is well below the mean alveolar PCO2, whereas during expiration, alveolar PCO2 increases toward mixed venous PCO2 more rapidly than at rest as the increased CO2 production of exercise is evolved into a lung volume becoming smaller as expiration continues [32]. The latter factor results in PETCO2 being higher than mean PaCO2 during exercise [33], and therefore PETCO2 has the potential to overestimate PaCO2 at peak exercise. In patients with lung disease who generally have a blunted tidal volume response to exercise, and a relatively low peak metabolic rate, the within-breath fluctuations of alveolar PCO2 are likely less than what would be seen in health. Rather, a larger issue in lung disease is the increased dead space ventilation and likely underestimation of PaCO2 using PETCO2. Jones et al. developed a prediction equation to calculate PaCO2 from PETCO2 during exercise [PaCO2 = 5.5 + (0.90 × PETCO2) − (0.0021 × tidal volume)] [32]; however, it is worth noting that this equation was developed with subjects exercising up to 50% . Further, it was suggested that the equation should not be used in patients with abnormal pulmonary function nor in children [32]. Thus, there are limitations with using PETCO2 as a prediction of PaCO2 that need to be considered when interpreting CPET data. Arterialized blood can also be used to predict PaCO2 with reasonable accuracy [34, 35] but is practically more difficult as compared to PETCO2.
4. Dead Space Ventilation
As shown in (4), total expired minute ventilation (), measured at the mouth, consists of both alveolar ventilation () and physiologic dead space ventilation ():
| (4) |
Alveolar ventilation is the amount of effective ventilation that participates in gas exchange. Physiological dead space is ventilation that does not participate in gas exchange and consists of anatomical dead space such as the conducting airways, as well as alveolar dead space which are unperfused alveoli. Physiological dead space can be calculated as a fraction of total ventilation using the Enghoff modification [36] of the Bohr [37] dead space equation:
| (5) |
where PECO2 represented the mean PCO2 in the expired air. Examining this equation, dead space ventilation (i.e., ratio) would be zero if mean expired PCO2 was equal to arterial PCO2. Conversely, significant dead space results in expiration of gas that is more similar to inspired PCO2 (i.e., sections of the lung that did not participate in gas exchange and therefore have a PCO2 ~ 0), which has the effect of diluting the expired air and reducing PECO2 relative to PaCO2. Of note, many metabolic carts typically calculate a dead space/tidal volume ratio (V D/V T ratio, i.e., dead space per breath), using the same equation as listed in (5). However, these calculations are often based on a PaCO2 that is predicted from PETCO2, and therefore significant caution should be taken in interpreting V D/V T values that are not derived using direct PaCO2 measurement.
5. Breathing Pattern Response to Exercise
The precise matching of alveolar ventilation with metabolic rate during exercise is achieved by increasing minute ventilation. This increase is accomplished by increases in both tidal volume and breathing frequency. The increased tidal volume slightly increases airway dead space, due to tethering effects of the lung parenchyma on airway lumen size. However, the relative tidal volume increase exceeds this effect, and the dead space to tidal volume ratio decreases during exercise from resting values of ~0.35 to ~0.20, translating into more efficient ventilation [1]. During low-to-moderate intensity exercise, both tidal volume and breathing frequency increase roughly in proportion to exercise intensity, whereas at higher intensities, tidal volume reaches a plateau and further increases in ventilation are accomplished by increases in breathing frequency alone [1].
Increases in breathing frequency are accomplished by reducing both the inspiratory (T I) and expiratory times (T E). However, the ratio of inspiratory time to total breath cycle duration (T TOT), the duty cycle (T I/T TOT), increases only slightly during exercise (~0.40 at rest to ~0.50 during high-intensity exercise) [38]. The increase in tidal volume is achieved by reducing the end-expiratory lung volume (EELV) below the functional residual capacity (achieved by activating expiratory muscles) and increasing the end-inspiratory lung volume (see later section on EELV determination) [38]. At lower exercise intensities, increases in ventilation are mostly achieved through tidal volume changes, rather than just increasing breathing frequency, which would increase dead space ventilation and compromise effective alveolar ventilation. To minimize the work of breathing during heavier exercise, tidal volume increases only to ~70% of the vital capacity [39], as above this lung volume, lung compliance decreases markedly and the respiratory pressure production required for a given change in volume is very large, leading to exaggerated respiratory discomfort (i.e., dyspnea) [40].
6. Ventilatory Efficiency
Ventilatory efficiency is typically evaluated by the responses to exercise, and as the term implies, it provides information about the effectiveness of minute ventilation for a given metabolic rate. Importantly, ventilatory efficiency has been shown to be decreased in several clinical conditions including chronic obstructive pulmonary disease (COPD), pulmonary arterial hypertension (PAH) [41, 42], and in heart failure [43]. In patients with PAH [42] and chronic heart failure [43], the ratio is predictive of mortality. Importantly, when is elevated it is important to understand the underlying physiological mechanism for the increased relative to metabolic rate. As shown in (4), would be elevated because of an increase in dead space and/or alveolar ventilation. In pulmonary arterial hypertension, the characteristic response is of pronounced hyperventilation at rest and with incremental exercise likely because of stimulation of receptors in the lung secondary to high vascular pressures [44]. In this condition, the enhanced response to exercise is secondary to greater as demonstrated by a low PaCO2 (or PETCO2) throughout exercise [41, 42]. Patients with chronic heart failure (CHF) also show an exaggerated response to exercise [43]; however, PaCO2 can appear normal in these patients [45], indicating that the increased is secondary to enhanced dead space ventilation.
Lung diseases associated with airflow limitation and/or a loss of elastic recoil can lead to altered ventilation/perfusion () matching in the lung [46]. As a result of the reduction in matching, physiological dead space is increased, and therefore V D/V T and will be increased with incremental exercise as compared to controls [47]. In these patients is exaggerated while PaCO2 is normal or perhaps even elevated, indicating that the increased for a given metabolic rate is secondary to increased dead space. This reduction in ventilatory efficiency can further compromise exercise tolerance and potentiate dyspnea in patients with obstructive lung disease as their ventilatory reserve is already reduced, and therefore they have both an inability to increase because of airflow limitation, plus a need to have a greater for a given metabolic rate because of altered matching and the associated increased dead space ventilation. These examples highlight how the and PaCO2 responses to exercise can be used to differentiate between pathologies and mechanisms of dyspnea.
7. Ventilatory Reserve
Traditionally, ventilatory reserve has been evaluated by examining how closely the peak minute ventilation on a CPET () approaches the greatest volume of gas that can be breathed per minute by voluntary effort, termed the maximal voluntary ventilation (MVV). Previous guidelines state that breathing reserve [] should be >15% at peak exercise [1]. This method provides a general approximation of ventilatory capacity, with little analysis required. Ventilatory reserve depends on two main factors: ventilatory demand and ventilatory capacity [46, 48]. Ventilatory demand is dependent on metabolic demand, body weight, mode of testing, dead space ventilation as well as neuroregulatory and behavioral factors [48]. Ventilatory capacity is affected by mechanical factors such as airflow limitation and operating lung volumes, ventilatory muscle function, genetic endowment, aging, and disease [48]. Ventilatory capacity can also be affected by bronchoconstriction or bronchodilation [48]. Thus, a reduction in ventilatory reserve may be explained by increased ventilatory demand (such as during heavy exercise in an athlete or with inefficient ventilation) and/or reduced ventilatory capacity (typically due to airflow limitation).
Importantly, there are limitations to determining MVV which can affect determination of ventilatory reserve, and further, there are mechanical differences between voluntary hyperventilation at rest and exercise-induced hyperpnea. When performing an MVV at rest, subjects often hyperinflate, which can increase work of breathing relative to the same ventilation during exercise [46, 49–51]. In addition, MVV is subject to patient effort, and with poor effort the MVV can be low and the calculated ventilatory reserve falsely reduced. Because of the difficulties in measuring MVV, it is often predicted based on FEV1 (typically FEV1 multiplied by 35–40) [48, 52], and as with any prediction equation, there is variance around the accuracy of this prediction. Most importantly, using only the breathing reserve does not provide any information about the mechanism of ventilatory constraint (i.e., is there evidence of expiratory flow limitation or hyperinflation?) [46]. It is for these reasons that examining expiratory flow limitation and operating lung volumes has evolved as the preferred technique to examine a ventilatory limitation to exercise.
8. Expiratory Flow Limitation
To evaluate the degree of ventilatory constraint during exercise, the degree of expiratory flow limitation (EFL) can be examined by plotting the exercise flow-volume loop relative to the maximal flow [46]. This relationship can provide information about the degree of expiratory flow limitation, operating lung volumes, as well as breathing strategies used with incremental exercise. The degree of EFL during exercise has been previously expressed as a percent of V T that meets or exceeds the expiratory boundary [48, 53, 54]. The presence of EFL promotes dynamic hyperinflation and intrinsic positive end-expiratory pressure with increased work of breathing, functional impairment of inspiratory muscle strength, increased sensations of dyspnea, and adverse effects on hemodynamics [55, 56]. When the degree of expiratory flow limitation becomes significant (>40–50% ), EELV typically increases [48, 53, 57, 58].
Many of the modern metabolic carts allow for evaluation of EFL by plotting exercise tidal breathing within a maximal flow-volume loop. However, there is no clear consensus regarding the quantification of EFL. Johnson et al. [48] suggested an evaluation criteria regarding EFL and inspiratory capacity (IC); however, this had not been widely adopted clinically. Instead, most typically categorize EFL as an “all or none” criteria. Importantly, it is not unusual for a normal young (<35 yrs) subject of average fitness and no lung disease to have EFL of <25% of V T at peak exercise [48, 49, 59, 60]. Thus, the clinical significance of some EFL occurring at or close to peak exercise is unclear.
By definition, EFL requires the demonstration of an increase in transpulmonary pressure with no increase in expiratory flow [56]. As well reviewed recently by Calverley and Koulouris [56], the comparison of tidal breathing relative to the maximal flow volume loop has its limitations including (1) thoracic gas compression artifact; to reduce these errors volume should be measured using a body plethysmograph instead of the typical Pneumotach. (2) Incorrect alignment of the tidal breathing curve within the maximal flow-volume loop. (3) The previous volume and time history of a spontaneous tidal breath is different than the flow-volume curve derived from the maximum forced vital capacity; there is not a single maximum flow volume curve, but rather a family of curves which are dependent on the time course of the preceding forced vital capacity [56, 61–63]. (4) Mechanics and time-constant inequalities are different in tidal versus maximal flow-volume curves. (5) Exercise may cause bronchodilation/bronchoconstriction. (6) The technique requires good patient cooperation/effort. Guenette et al. [64] recently demonstrated that failure to account for gas compression and exercise-induced bronchodilation results in a significant overestimation of EFL. As a result of these limitations, the use of plotting tidal breathing relative to the maximal flow-volume loop to detect/quantify EFL has been questioned [56], although many of these potential limitations can be avoided or minimized with the use of standardized techniques.
As an alternative, the negative expiratory pressure method has been advocated for the detection of EFL. As the name implies, with this technique a small negative pressure (i.e., suction of −3 to −5 cm H2O) is given during expiration [56]. This method is based on the principle that in the absence of EFL, an increase in the pressure gradient between the alveoli and the mouth would increase flow, whereas with EFL increasing the pressure gradient would not increase flow [56]. This technique has been used during exercise to demonstrate EFL in lung disease [65–67]; however, it does not allow for quantification of severity of EFL and has not been adopted during widespread clinical practice.
9. Inspiratory Capacity
With EFL, expiratory flow rates are independent of expiratory muscle effort and are determined by the static lung recoil pressure and the resistance of the airways upstream from the flow-limited segment [60, 68, 69]. In flow-limited patients, the mechanical time constant for lung emptying is increased in many alveolar units, but the expiratory time available is often insufficient to allow EELV to return to its original values, resulting in gas accumulation and retention (i.e., air trapping) [60]. As demonstrated by (3), the increased CO2 production with exercise necessitates an increase in by increasing V T and breathing frequency to maintain PaCO2. However, the increased tidal volume in combination with diminished expiratory time due to increased breathing frequency can cause dynamic hyperinflation in patients with EFL [60]. Thus, the main consequence of expiratory flow limitation during exercise is the development of dynamic hyperinflation (DH) [47, 60].
As reviewed recently by O'Donnell and Lavenziana [60], DH during exercise has several important consequences including (1) a sudden increase in elastic and threshold loads on the inspiratory muscles, leading to increased work and O2 cost of breathing. (2) Functional inspiratory muscle weakness by shortening the diaphragm muscle length. (3) Reducing the ability of V T to expand appropriately with exercise, leading to a mechanical limitation of ventilation. (4) Hypoventilation and hypoxemia in more severe patients [70]. (5) Impairment in cardiac function. In COPD patients, was strongly related to peak tidal volume (r = 0.68), which in turn was strongly related to IC at peak exercise (r = 0.79) [71]. These results indicate that DH blunts the tidal volume expansion with incremental exercise, which contributes to exercise intolerance/reduced . Consistent with the consequences of IC listed, the IC during exercise and the rate of change in IC with exercise (i.e., dynamic hyperinflation) are strong determinants of exertional dyspnea and exercise intolerance [71–73].
Dynamic hyperinflation in early exercise may be a compensatory mechanism to increase with limited (or minimal) respiratory discomfort [74]; however, with increasing exercise a threshold is reached (around an inspiratory reserve volume of 0.5 L, or within 10% of total lung capacity), where V T plateaus [60, 74]. At this point the breathing occurs at the least compliant portion of the respiratory system's pressure-volume curve; the diaphragm muscle fibers are maximally shortened, and dyspnea develops at an extremely accelerated rate because of the disparity between the inspiratory effort and tidal volume response [60, 74].
Recent work has shown that below this tidal volume inflection (or plateau), dyspnea increases linearly with workload; however once IC drops below a critical value, dyspnea increases abruptly and becomes the most frequently selected reason for exercise termination regardless of exercise protocol [75]. The rate of dynamic hyperinflation has been shown to be correlated with diffusion capacity (DLCO/) [71]. Patients with lower DLCO would be expected to have a greater propensity to expiratory flow limitation because of reduced lung elastic recoil and airway tethering. Patients with a more emphysematous clinical profile (i.e., low DLCO) have been shown to have a greater rate of dynamic hyperinflation, less expansion of tidal volume, greater dyspnea, and lower as compared to patients with similar airflow obstruction, but normal DLCO [71]. More recent work has shown that in COPD patients it may be the progressive erosion of resting IC with worsening airflow obstruction and hyperinflation that represents the true operating limits for tidal volume expansion from rest to exercise [76]. O'Donnell et al. [76] found that reductions in resting IC were associated with the development of an increasingly shallow, rapid breathing pattern and worsening dyspnea at progressively lower levels of ventilation during exercise. Importantly, regardless of the severity of airflow limitation, once V T reaches the previously described threshold, there was a steep increase in dyspnea [76]. Other recent work has shown that it may not be the drop in IC but rather a critical reduction in inspiratory reserve volume that causes the plateau in V T and marked increase in dyspnea [77]. These findings indicate that EFL contributes to DH, and once EELV has increased to a critical value and/or inspiratory reserve volume drops to a critical value, dyspnea is greatly potentiated, resulting in substantial exercise limitation.
Serial inspiratory capacity maneuvers are used during incremental exercise to evaluate EELV/IC progression with exercise. The use of IC to track EELV during exercise is based on the assumption that total lung capacity (TLC) does not change during exercise, and that reductions in IC represent changes in EELV (i.e., EELV = TLC − IC) [78, 79]. Inspiratory capacity is determined by the degree of hyperinflation, inspiratory muscle strength, and the extent of intrinsic mechanical loading on the inspiratory muscles [72]. The IC also provides information regarding the position of the tidal volume on the respiratory system's pressure-volume curve [72]. The lower the IC, the closer towards TLC the subject is breathing, which is the least compliant portion of the respiratory system's pressure-volume curve. Previous work has also shown that IC determination can be reliably obtained during exercise [72, 80]. When performing serial IC measurements with incremental exercise, a good effort is required to inspire up to TLC during each maneuver so as to ensure IC is not becoming falsely reduced because of inadequate inspiration. Esophageal pressure data confirms that peak esophageal pressure (an estimate of effort) does not change with repeated IC measurements, thereby indicating that serial ICs are valid with incremental exercise testing [72, 73, 80]. In addition to IC maneuvers, changes in EELV during exercise can also be tracked with newer methods such as optoelectronic plethysmography or respiratory inductance plethysmography [81, 82]; however, these techniques have not been adopted widely for clinical use.
10. Pulmonary Gas Exchange
Pulmonary gas exchange is typically evaluated by alveolar-arterial oxygen partial pressure difference (AaDO2 = PAO2 − PaO2). The stress of exercise on pulmonary gas exchange can be highlighted by the following two equations. For a hypothetical homogeneous lung with no heterogeneity, the physiological definition of lung diffusion capacity for O2 (DLO2) is [28]:
| (6) |
PcO2 is the mean PO2 passing through the pulmonary capillaries, which cannot be measured and therefore is estimated by arterial blood sampling. Assuming PcO2 = PaO2 this equation can be rearranged to:
| (7) |
This physiological definition demonstrates that with the increased O2 consumption with exercise, the lung must increase its diffusive capacity in order to limit the increase in AaDO2 [28]. DLO2 increases with exercise as a result of capillary recruitment, as demonstrated by an increase in diffusion capacity with exercise [83–88]. From this equation it is intuitive as to how exercise may result in impaired gas exchange in patients with lung disease, resulting in decreased and/or increased dyspnea. Patients with a diffusion impairment at rest from thickening of the blood gas barrier, such as in interstitial lung disease, would be expected to show an increase in AaDO2 with exercise, while patients who have an inability to recruit pulmonary capillaries and therefore increase DLO2 because of capillary destruction (i.e., COPD) would also increase AaDO2 with exercise. Importantly, in addition to the impact on recruitment of diffusion capacity, lung disease can also result in greater mismatch which can be exacerbated with exercise, resulting in further deterioration in gas exchange.
In health, most exercising humans show an increase in AaDO2 with incremental exercise which reaches its peak at [30, 89], but remains within normal limits (i.e., <35 mmHg) [1]. The AaDO2 appears greatest in endurance athletes, and in severe cases may cause hypoxemia [30, 89], which is somewhat counterintuitive as one would expect endurance athletes to have an excellent cardiopulmonary system. The increase in AaDO2 with exercise has been an area of physiological interest and is likely explained by a combination of mismatch [90–92] and diffusion limitation secondarily to reduced red blood cell transit time or the development of interstitial non-clinical edema [90–93] and/or the recruitment of intrapulmonary arteriovenous shunts [94, 95]. Importantly, despite the attention given to pulmonary gas exchange in the research literature, exercise-induced arterial hypoxemia is uncommon in all but the most highly aerobic athletes. Thus, further clinical followup may be warranted in symptomatic non-athletic subjects who demonstrate an exaggerated AaDO2 (>35 mmHg) and/or decreased PaO2 with exercise.
As measurement of PaO2 requires arterial catheterization, most CPET studies are conducted by monitoring arterial saturation by pulse oximetry (SpO2). While SpO2 may be appropriate for monitoring, care should be taken when interpreting this data. Firstly, the standard error of estimate for SpO2 monitors is between 2% and 5% [96–98]. SpO2 monitors can also bias low when blood flow is reduced, such as what can occur with a finger oximeter while subjects are exercising vigorously on a cycle ergometer. Previous work suggests that an oximeter placed on the forehead provides the most accurate readings [97]. When using SpO2 to evaluate gas exchange during normoxic exercise, it is important to note that within the typical exercise range, SaO2 values are on the flat part of the oxygen hemoglobin dissociation curve, and within this range relatively small changes in SaO2 are associated with large differences in PaO2. Thus, even small uncertainties in SaO2 would have a big effect on estimated PaO2 [97]. SaO2 is also affected by the temperature and pH changes during exercise, and these alone can result in a SpO2 decrease of 4%-5% in the absence of any change in PaO2. Finally, should hypoxemia develop, it is not possible to determine if hypoxemia is secondary to an impairment in gas exchange (i.e., increased AaDO2) or significant hypoventilation with a corresponding drop in PAO2 and PaO2. Previous guidelines [1] define an SpO2 of 88% during exercise as significant hypoxemia; however, this value does not rule out the development of a significant gas exchange impairment, and therefore temperature-corrected arterial blood gas data should be used if careful gas exchange evaluation is needed.
11. CPET Interpretation
The purpose of the previous sections was to highlight the physiological responses to exercise, and how decrements in cardiopulmonary physiology can lead to dyspnea and exercise intolerance. While a great deal of research has examined cardiopulmonary physiology and exercise, these findings still make it somewhat difficult to integrate all the data obtained in a CPET to provide a clear clinical interpretation of the mechanism(s) contributing to dyspnea/exercise intolerance in symptomatic individuals. Previous position statements have provided insight [1], and the purpose of this section is to provide guidelines to help clinicians evaluate CPET responses. It should be noted that the interpretation strategy described may not apply to all conditions and remains an evolving process. It is also important to appreciate that there are various contraindications to CPET (see Table 2).
Table 2.
Contraindications for cardiopulmonary exercise testing.
| Acute myocardial infarction |
| Unstable angina |
| Unstable arrhythmias |
| Syncope |
| Symptomatic severe aortic stenosis |
| Any acute pulmonary symptom |
| Any acute infectious process |
| Inability to comply with testing procedures |
12. Determination of Maximal Patient Effort
Prior to full interpretation of a CPET, determination of maximal patient effort is required. Previous guidelines [1] list the following as evidence of maximal patient effort. (1) The patient achieves predicted and/or a plateau in is observed. (2) Predicted maximal work rate is achieved. (3) Predicted maximal heart rate is achieved. (4) There is evidence of a ventilatory limitation; that is, peak exercise ventilation approaches or exceeds maximal ventilatory capacity. (5) A respiratory exchange ratio (RER, often called respiratory quotient (RQ)) greater than 1.15. (6) Patient exhaustion/Borg scale rating of 9-10 on a 10-point scale.
Importantly, because of the cardiovascular adaptations observed in athletes, these subjects often exceed predicted and predicted maximal work rate even during submaximal work, and therefore we would suggest that reaching predicted or or maximum work rate should not be evidence of a maximal effort. Based on this and new research detailed previously on EFL and changes in IC with exercise, we would suggest the following criteria for determination of maximal effort.
Criteria for Maximal Effort —
RER ≥ 1.1.
HR > 90% predicted max.
Patient exhaustion/Borg scale > 9/10.
Was there a plateau in ?
Was there evidence of a ventilatory limitation (breathing reserve <15% and/or significant EFL and/or decrease in IC)?
Importantly, there is no gold standard for evaluating maximal effort [1]. There is currently disagreement as to whether hypoxemia is evidence of a maximal effort. As hypoxemia can develop during submaximal exercise in some patients (e.g., interstitial lung disease), it has been suggested that this is not evidence of a maximal test [1], while others have indicated that hypoxemia is indeed confirmation of a maximal test [99].
With respect to the above-listed criteria, when more criteria are attained during a CPET, there would be more confidence that a maximal patient effort has been obtained. Notably, patients often have difficulty reaching a plateau in , and considering the between-subject variability in maximal heart rate [25], both criteria (2) and (4) are frequently not reached despite maximal effort. Further, while patients may achieve exhaustion with CPET testing (3), their Borg scale may be high, but not exceed a value of “9” on Borg scale as defined by previous guidelines [1]. It is also important to note that in the absence of respiratory disease, criteria (5) is rarely obtained. Conversely, in the presence of a significant ventilatory limitation (5), criteria 1, 2 and 4 may not be achieved despite maximal patient effort. Severe hypoxemia/gas exchange impairment, chest pain, ischemic ECG changes, and decreases in heart rate and blood pressure can occur during submaximal exercise and are not evidence of maximal effort [1], but may be very informative in the interpretation of test results.
13. Evaluation of Peak Oxygen Consumption
As is affected by age and sex, conditioning status, and the presence of diseases or medications that can influence its components, accurate interpretation of exercise data requires reference values that are appropriate for each patient (see [1] for a comprehensive list of reference formulas). As with any criteria, the determination of low/abnormal is somewhat arbitrary. The American Thoracic Society/American College of Chest Physicians statement on cardiopulmonary exercise testing defines a of predicted as abnormal [1]. When examining long-term survival, subjects with an absolute peak exercise capacity of >8 metabolic equivalents (METS) regardless of age, have improved survival as compared to subjects with a peak workload of 5–8 METS, or below 5 METS [100]. When exercise capacity is expressed as a % of predicted, subjects who attain a of 75%–100% of predicted have lower survival than those who reach of predicted, and survival is correspondingly lower for those with a 50 to 74% and those with a of predicted, respectively [100]. These findings indicate that a below age-predicted, but still within typical values (i.e., 75%–100% of predicted), is associated with increased mortality and is therefore clinically important.
is highly dependent on chronic physical fitness/exercise history and can be increased with exercise training and conversely reduced with inactivity. This is noteworthy when evaluating a previously athletic individual, as in these individuals a of ~100% of predicted may represent a substantial reduction in previous functional ability. The next section will now review how to determine whether the exercise intolerance can be explained by a pulmonary or cardiovascular limitation to exercise and whether this limitation is physiological (i.e., normal) or pathological.
14. Determining Exercise Limitation
Importantly, the data obtained from a CPET test should not be interpreted in isolation. Rather, the interpretation should be an integration of CPET results with other clinical findings/investigations. In addition to the data directly obtained from the CPET, feedback from the patient, including reason for exercise termination, can be useful in evaluating exercise limitation. Figure 1 provides a guideline for CPET interpretation and classification based on previous work [48, 53, 57, 58, 60, 70, 74].
Figure 1.
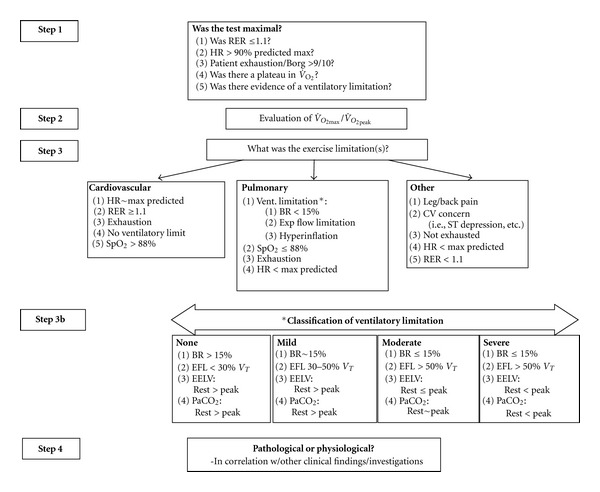
Interpretation algorithm for cardiopulmonary exercise testing. This figure provides an outline of a CPET interpretation strategy and suggested classification of ventilatory limitation based on previous work [1, 48, 53, 57, 58, 60, 70, 74]. Importantly, the data obtained from a CPET test should not be interpreted in isolation, but rather results should be integrated with other clinical findings/investigations. RER: respiratory exchange ratio, oxygen consumption, HR: heart rate, SpO2: arterial saturation, BR: breathing reserve, CV: cardiovascular, EFL: expiratory flow limitation, V T: tidal volume, EELV: end-expiratory lung volume, PaCO2: arterial PCO2.
As detailed previously, is determined by the Fick equation. Increases in cardiac output/blood flow result in increased , indicating that the normal person has a cardiovascular limitation to exercise. These subjects would surpass their ventilatory threshold, and therefore the RER would be expected to be >1.1, while HR should approach age-predicted maximum. In these subjects EFL, increases in EELV, and significant gas exchange impairment would not develop with exercise. Subjects who, despite showing a normal pulmonary, cardiovascular and metabolic response to exercise, still have a low V O2max would be classified as being deconditioned. In contrast, subjects showing ECG changes with exercise, an exaggerated BP response to exercise, a significant drop in BP or HR with exercise, exaggerated response with hyperventilation, and a very low would be suggestive of a pathological cardiovascular limitation to exercise. Thus, a cardiovascular limitation to exercise is the interpretation of default; that is, in the absence of any abnormal/pathological response, subjects are limited by their cardiovascular system.
When ventilatory demand is excessive or ventilatory capacity is reduced, a ventilatory limitation to exercise can develop. Ventilatory reserve is related to ventilatory demand, and ventilatory capacity [46, 48]; however because of the difficulties in determining MVV and the lack of information provided about the mechanism of ventilatory constraint, ventilatory reserve in isolation is a more rudimentary evaluation of ventilatory limitation, and determination of EFL and IC is preferable. As mentioned previously, EFL determination also has its limitations, and failure to account for variables such as thoracic gas compression and exercise-induced bronchodilation/bronchoconstriction will result in an overestimation of EFL [64]. Since an EFL < 25% of V T can occur at maximal exercise in normal subjects [48, 49, 59, 60], it is unlikely that this amount of EFL should be considered abnormal and clinically significant. The development of EFL for >40%–50% V T is abnormal and can result in an increase in EELV [48, 53, 57, 58]. As EFL contributes to work of breathing and functional impairment of inspiratory muscle strength [55, 56], significant EFL by itself would contribute to perceived dyspnea and exercise intolerance. The development of EFL with a decrease in IC would represent a more severe respiratory limitation and also result in a plateau in tidal volume expansion and potentiated dyspnea [60, 74]. In the most severe cases, hypercapnea and hypoxemia would develop, as ventilation is insufficient to meet metabolic demand. In many cases, the ventilatory limitation to exercise is so severe that the patient does not reach their ventilatory threshold (i.e., an RER < 1.0 at peak) or age-predicted maximum heart rate. Some subjects demonstrate a reduction in IC with exercise despite normal lung function and no evidence of EFL or any other mechanical limitation. In these situations, behavioral conditions such as anxiety should be considered. See Figure 1 for a suggested classification of ventilatory limitation based on previous work [48, 53, 57, 58, 60, 70, 74].
The pulmonary system can further contribute to exercise intolerance by failing to maintain adequate arterial oxygenation. Previous guidelines indicate a fall in SaO2 of ≥4%, SaO2 ≤ 88% or PaO2 ≤ 55 mmHg is considered clinically significant [1]. As mentioned, SaO2/SpO2 evaluated in isolation does not allow for determination of the underlying mechanism for hypoxemia (i.e., hypoventilation versus gas exchange impairment versus lactic acidosis/hyperthermia).
Poor ventilatory efficiency (i.e., high ) can be characteristic of various cardiovascular and pulmonary diseases. Importantly, an abnormal response may be a signal to obtain arterial blood gases during exercise so that PaCO2 and dead space ventilation can be directly determined [1]. A high ratio in isolation may contribute to dyspnea but is not likely to contribute to exercise intolerance by itself. However, with an exaggerated ventilatory response to exercise EFL and an increase in EELV that may develop, and these components would contribute to exercise intolerance.
Other patients may terminate a CPET because of alternate issues such as back pain and knee pain. In addition, the testing staff may terminate the exercise because of safety concerns (ECG changes, altered BP response, etc.). In these situations, the test would be terminated because of a noncardiopulmonary limitation, and it is unlikely that the patient would have reached maximal patient effort.
As a final step, the clinician should determine whether the limitation to exercise is physiological (i.e., normal) or pathological and needing further followup. By way of example, a subject with a low , but otherwise normal test, would have a physiological cardiovascular limitation to exercise whereby the low is explained by deconditioning. A subject with a similar , but showing abnormal ECG or BP responses, would have a pathological cardiovascular limitation requiring further followup. A COPD patient who has a low , but otherwise normal test (including a normal ventilatory response to exercise), would have a physiological cardiovascular limitation to exercise whereby the low is explained by deconditioning. While in contrast, a COPD patient who has a low but substantial EFL and hyperinflation would have a pathological respiratory limitation to exercise. Respiratory limitations to exercise are typically pathological, except in the case of an athlete with superior cardiovascular function and normal lung function [28]. These athletes can demonstrate EFL, increased EELV and gas exchange impairment; however, this is an example of the cardiovascular system outgrowing the lungs, and not pulmonary pathology [28]. Of note, patients may demonstrate evidence of both a cardiovascular and pulmonary limitation to exercise.
15. Summary
As reviewed in this paper, exercise represents a significant stress to the cardiopulmonary system. With exercise, oxygen delivery and local muscle O2 extraction must increase appropriately to meet metabolic demand. Ventilation must similarly increase to compensate for the increased CO2 production and maintain alveolar ventilation, while diffusion capacity must also be augmented to maintain arterial PO2. The normal subject has a breathing reserve even at maximal exercise, and therefore expiratory flow limitation and/or hyperinflation should not occur with exercise. In addition, healthy subjects maintain oxygenation up to peak exercise because of an appropriate increase in diffusion capacity. The failure to have an appropriate cardiovascular, ventilatory, or gas exchange response to exercise can result in greater exertional dyspnea and/or exercise tolerance. As outlined in the paper, examining the cardiopulmonary responses to a CPET can provide additional clinical data that is not available through resting tests of lung and cardiac function and can help clinicians determine mechanism(s) for exercise intolerance and/or dyspnea.
Acknowledgment
M. K. Stickland was supported by a Heart and Stroke Foundation of Canada New Investigator Award.
Abbreviations
- Alveolar PO2:
PAO2
- Alveolar ventilation:
- Arterial O2 content:
CaO2
- Arterial PO2:
PaO2
- Arterial saturation:
SaO2
- Arterial saturation by pulse oximetry:
SpO2
- Cardiopulmonary exercise test:
CPET
- CO2 production:
- Diffusion capacity for carbon monoxide:
DLCO
- Diffusion capacity for O2:
DLO2
- End-tidal CO2:
PETCO2
- End-tidal O2:
PETO2
- Expiratory flow limitation:
EFL
- Expiratory lung volume:
EELV
- Expiratory time:
T E
- Heart rate:
HR
- Inspiratory capacity:
IC
- Inspiratory time:
T I
- Maximal oxygen consumption:
- Maximal voluntary ventilation:
MVV
- Metabolic equivalents:
METS
- Minute ventilation:
- Mixed venous O2 content:
CvO2
- Peak minute ventilation:
- Peak oxygen consumption:
- Physiologic dead space ventilation:
- Pulmonary arterial hypertension:
PAH
- Tidal volume:
V T
- Total breath cycle duration:
T TOT
- Total lung capacity:
TLC
- Ventilation/perfusion:
.
References
- 1.ATS/ACCP. Statement on cardiopulmonary exercise testing. American Journal of Respiratory and Critical Care Medicine. 2003;167(2):211–277. doi: 10.1164/rccm.167.2.211. [DOI] [PubMed] [Google Scholar]
- 2.Palange P, Ward SA, Carlsen KH, et al. Recommendations on the use of exercise testing in clinical practice. European Respiratory Journal. 2007;29(1):185–209. doi: 10.1183/09031936.00046906. [DOI] [PubMed] [Google Scholar]
- 3.DePaso WJ, Winterbauer RH, Lusk JA, Dreis DF, Springmeyer SC. Chronic dyspnea unexplained by history, physical examination, chest roentgenogram, and spirometry; Analysis of a seven-year experience. Chest. 1991;100(5):1293–1299. doi: 10.1378/chest.100.5.1293. [DOI] [PubMed] [Google Scholar]
- 4.Pratter MR, Curley FJ, Dubois J, Irwin RS. Cause and evaluation of chronic dyspnea in a pulmonary disease clinic. Archives of Internal Medicine. 1989;149(10):2277–2282. [PubMed] [Google Scholar]
- 5.Balady GJ, Arena R, Sietsema K, et al. Clinician’s guide to cardiopulmonary exercise testing in adults: a scientific statement from the American heart association. Circulation. 2010;122(2):191–225. doi: 10.1161/CIR.0b013e3181e52e69. [DOI] [PubMed] [Google Scholar]
- 6.Weisman IM, Zeballos RJ. An integrated approach to the interpretation of cardiopulmonary exercise testing. Clinics in Chest Medicine. 1994;15(2):421–445. [PubMed] [Google Scholar]
- 7.Wagner PD. Determinants of maximal oxygen transport and utilization. Annual Review of Physiology. 1996;58:21–50. doi: 10.1146/annurev.ph.58.030196.000321. [DOI] [PubMed] [Google Scholar]
- 8.Powers SK, Lawler J, Dempsey JA, Dodd S, Landry G. Effects of incomplete pulmonary gas exchange on VO2 max. Journal of Applied Physiology. 1989;66(6):2491–2495. doi: 10.1152/jappl.1989.66.6.2491. [DOI] [PubMed] [Google Scholar]
- 9.Saltin B, Blomqvist G, Mitchell JH, Johnson RL, Jr, Wildenthal K, Chapman CB. Response to exercise after bed rest and after training. Circulation. 1968;38(supplement 5):VII1–78. [PubMed] [Google Scholar]
- 10.Ekblom B, Astrand PO, Saltin B, Stenberg J, Wallström B. Effect of training on circulatory response to exercise. Journal of applied physiology. 1968;24(4):518–528. doi: 10.1152/jappl.1968.24.4.518. [DOI] [PubMed] [Google Scholar]
- 11.Holloszy JO, Coyle EF. Adaptations of skeletal muscle to endurance exercise and their metabolic consequences. Journal of Applied Physiology Respiratory Environmental and Exercise Physiology. 1984;56(4):831–838. doi: 10.1152/jappl.1984.56.4.831. [DOI] [PubMed] [Google Scholar]
- 12.Green DJ, Naylor LH, George K, Dempsey JA, Stickland MK, Katayama K. Cardiovascular and pulmonary adaptations to endurance training. In: Green DJ, Naylor LH, editors. Physiological Bases of Human Performance During Work and Exercise. New York, NY, USA: Elsevier; 2008. pp. 49–70. [Google Scholar]
- 13.Di Bello V, Santoro G, Talarico L, et al. Left ventricular function during exercise in athletes and in sedentary men. Medicine and Science in Sports and Exercise. 1996;28(2):190–196. doi: 10.1097/00005768-199602000-00006. [DOI] [PubMed] [Google Scholar]
- 14.Levine BD, Lane LD, Buckey JC, Friedman DB, Gunnar Blomqvist C. Left ventricular pressure-volume and Frank-Starling relations in endurance athletes. Implications for orthostatic tolerance and exercise performance. Circulation. 1991;84(3):1016–1023. doi: 10.1161/01.cir.84.3.1016. [DOI] [PubMed] [Google Scholar]
- 15.Levy WC, Cerqueira MD, Abrass IB, Schwartz RS, Stratton JR. Endurance exercise training augments diastolic filling at rest and during exercise in healthy young and older men. Circulation. 1993;88(1):116–126. doi: 10.1161/01.cir.88.1.116. [DOI] [PubMed] [Google Scholar]
- 16.Nixon JV, Wright AR, Porter TR, Roy V, Arrowood JA. Effects of exercise on left ventricular diastolic performance in trained athletes. American Journal of Cardiology. 1991;68(9):945–949. doi: 10.1016/0002-9149(91)90414-g. [DOI] [PubMed] [Google Scholar]
- 17.Stickland MK, Welsh RC, Petersen SR, et al. Does fitness level modulate the cardiovascular hemodynamic response to exercise? Journal of Applied Physiology. 2006;100(6):1895–1901. doi: 10.1152/japplphysiol.01485.2005. [DOI] [PubMed] [Google Scholar]
- 18.Stray-Gundersen J, Musch TI, Haidet GC. The effect of pericardiectomy on maximal oxygen consumption and maximal cardiac output in untrained dogs. Circulation Research. 1986;58(4):523–530. doi: 10.1161/01.res.58.4.523. [DOI] [PubMed] [Google Scholar]
- 19.Tesch PA. Exercise performance and β-blockade. Sports Medicine. 1985;2(6):389–412. doi: 10.2165/00007256-198502060-00002. [DOI] [PubMed] [Google Scholar]
- 20.Howley ET, Bassett DR, Jr, Welch HG. Criteria for maximal oxygen uptake: review and commentary. Medicine and Science in Sports and Exercise. 1995;27(9):1292–1301. [PubMed] [Google Scholar]
- 21.Franklin BA, editor. ACSM’s Guidelines of Exercise Testing and Prescription. New York, NY, USA: Lippincott Williams & Wilkins; 2000. [Google Scholar]
- 22.Gibbons RJ, Balady GJ, Beasley JW, et al. ACC/AHA guidelines for exercise testing: a report of the American College of Cardiology/American Heart Association task force on practice guidelines (Committee on Exercise Testing) Journal of the American College of Cardiology. 1997;30(1):260–311. doi: 10.1016/s0735-1097(97)00150-2. [DOI] [PubMed] [Google Scholar]
- 23.Mitchell JH, Sproule BJ, Chapman CB. The physiological meaning of the maximal oxygen intake test. The Journal of Clinical Investigation. 1958;37(4):538–547. doi: 10.1172/JCI103636. [DOI] [PMC free article] [PubMed] [Google Scholar]
- 24.Grimby G, Nilsson NJ, Saltin B. Cardiac output during submaximal and maximal exercise in active middle-aged athletes. Journal of Applied Physiology. 1966;21(4):1150–1156. doi: 10.1152/jappl.1966.21.4.1150. [DOI] [PubMed] [Google Scholar]
- 25.Zhu N, Suarez-Lopez JR, Sidney S, et al. Longitudinal examination of age-predicted symptom-limited exercise maximum HR. Medicine and Science in Sports and Exercise. 2010;42(8):1519–1527. doi: 10.1249/MSS.0b013e3181cf8242. [DOI] [PMC free article] [PubMed] [Google Scholar]
- 26.Whipp BJ, Higgenbotham MB, Cobb FC. Estimating exercise stroke volume from asymptotic oxygen pulse in humans. Journal of Applied Physiology. 1996;81(6):2674–2679. doi: 10.1152/jappl.1996.81.6.2674. [DOI] [PubMed] [Google Scholar]
- 27.Rahn H, Fenn WO. A Graphical Analysis of the Respiratory Exchange: The O2-CO2 Diagram. Washington, DC, USA: American Physiological Society; 1955. [Google Scholar]
- 28.Stickland MK, Lindinger MI, Olfert IM, Heigenhauser GJ, Hopkins SR. Pulmonary gas exchange and acid-base balance during exercise. Comprehensive Physiology. 2013;3:1–47. doi: 10.1002/cphy.c110048. [DOI] [PMC free article] [PubMed] [Google Scholar]
- 29.Kellogg RH. Laws of physics pertaining to gas exchange. In: Fishman AP, Farhi LE, Tenney SM, Geiger SR, editors. Handbook of Physiology, The Respiratory System, Gas Exchange. 1987. pp. 13–30. [Google Scholar]
- 30.Dempsey JA, Wagner PD. Exercise-induced arterial hypoxemia. Journal of Applied Physiology. 1999;87(6):1997–2006. doi: 10.1152/jappl.1999.87.6.1997. [DOI] [PubMed] [Google Scholar]
- 31.Dubois AB, Britt AG, Fenn WO. Alveolar CO2 during the respiratory cycle. Journal of Applied Physiology. 1952;4(7):535–548. doi: 10.1152/jappl.1952.4.7.535. [DOI] [PubMed] [Google Scholar]
- 32.Jones NL, Robertson DG, Kane JW. Difference between end-tidal and arterial PCO2 in exercise. Journal of Applied Physiology Respiratory Environmental and Exercise Physiology. 1979;47(5):954–960. doi: 10.1152/jappl.1979.47.5.954. [DOI] [PubMed] [Google Scholar]
- 33.Jones NL, McHardy GJ, Naimark A, Campbell EJ. Physiological dead space and alveolar-arterial gas pressure differences during exercise. Clinical Science. 1966;31(1):19–29. [PubMed] [Google Scholar]
- 34.Zavorsky GS, Cao J, Mayo NE, Gabbay R, Murias JM. Arterial versus capillary blood gases: a meta-analysis. Respiratory Physiology and Neurobiology. 2007;155(3):268–279. doi: 10.1016/j.resp.2006.07.002. [DOI] [PubMed] [Google Scholar]
- 35.McLoughlin P, Popham P, Linton RAF, Bruce RCH, Band DM. Use of arterialized venous blood sampling during incremental exercise tests. Journal of Applied Physiology. 1992;73(3):937–940. doi: 10.1152/jappl.1992.73.3.937. [DOI] [PubMed] [Google Scholar]
- 36.Enghoff H. Volumen inefficax. Bemerkungen zur frage des schadlichen raumes. Uppsala Lakarefoeren Fohr. 1938;44:191–218. [Google Scholar]
- 37.Bohr C. Ueber die lungenatmung. Skandinavisches Archiv Fur Physiologie. 1891;2(1):236–268. [Google Scholar]
- 38.Henke KG, Sharratt M, Pegelow D, Dempsey JA. Regulation of end-expiratory lung volume during exercise. Journal of Applied Physiology. 1988;64(1):135–146. doi: 10.1152/jappl.1988.64.1.135. [DOI] [PubMed] [Google Scholar]
- 39.Dempsey JA, Johnson BD. Demand vs. capacity in the healthy pulmonary system. Schweizerische Zeitschrift fur Sportmedizin. 1992;40(2):55–64. [PubMed] [Google Scholar]
- 40.Jensen D, Ofir D, O’Donnell DE. Effects of pregnancy, obesity and aging on the intensity of perceived breathlessness during exercise in healthy humans. Respiratory Physiology and Neurobiology. 2009;167(1):87–100. doi: 10.1016/j.resp.2009.01.011. [DOI] [PubMed] [Google Scholar]
- 41.Sun XG, Hansen JE, Oudiz RJ, Wasserman K. Exercise pathophysiology in patients with primary pulmonary hypertension. Circulation. 2001;104(4):429–435. doi: 10.1161/hc2901.093198. [DOI] [PubMed] [Google Scholar]
- 42.Oudiz RJ, Midde R, Hovenesyan A, et al. Usefulness of right-to-left shunting and poor exercise gas exchange for predicting prognosis in patients with pulmonary arterial hypertension. American Journal of Cardiology. 2010;105(8):1186–1191. doi: 10.1016/j.amjcard.2009.12.024. [DOI] [PMC free article] [PubMed] [Google Scholar]
- 43.Ponikowski P, Francis DP, Piepoli MF, et al. Enhanced ventilatory response to exercise in patients with chronic heart failure and preserved exercise tolerance: marker of abnormal cardiorespiratory reflex control and predictor of poor prognosis. Circulation. 2001;103(7):967–972. doi: 10.1161/01.cir.103.7.967. [DOI] [PubMed] [Google Scholar]
- 44.Robertson HT, Pellegrino R, Pini D, et al. Exercise response after rapid intravenous infusion of saline in healthy humans. Journal of Applied Physiology. 2004;97(2):697–703. doi: 10.1152/japplphysiol.00108.2004. [DOI] [PubMed] [Google Scholar]
- 45.Wasserman K, Zhang YY, Gilt A, et al. Lung function and exercise gas exchange in chronic heart failure. Circulation. 1997;96(7):2221–2227. doi: 10.1161/01.cir.96.7.2221. [DOI] [PubMed] [Google Scholar]
- 46.Nici L. Mechanisms and measures of exercise intolerance in chronic obstructive pulmonary disease. Clinics in Chest Medicine. 2000;21(4):693–704. doi: 10.1016/s0272-5231(05)70178-7. [DOI] [PubMed] [Google Scholar]
- 47.Marin JM, Hussain SNA, Gibbons WJ, Polverino M, Levy RD, Cosio MG. Relationship of resting lung mechanics and exercise pattern of breathing in patients with chronic obstructive lung disease. Chest. 1993;104(3):705–711. doi: 10.1378/chest.104.3.705. [DOI] [PubMed] [Google Scholar]
- 48.Johnson BD, Weisman IM, Zeballos RJ, Beck KC. Emerging concepts in the evaluation of ventilatory limitation during exercise: the exercise tidal flow-volume loop. Chest. 1999;116(2):488–503. doi: 10.1378/chest.116.2.488. [DOI] [PubMed] [Google Scholar]
- 49.Younes M, Kivinen G. Respiratory mechanics and breathing pattern during and following maximal exercise. Journal of Applied Physiology Respiratory Environmental and Exercise Physiology. 1984;57(6):1773–1782. doi: 10.1152/jappl.1984.57.6.1773. [DOI] [PubMed] [Google Scholar]
- 50.Tzelepis G, McCool FD, Leith DE, Hoppin FG., Jr Increased lung volume limits endurance of inspiratory muscles. Journal of Applied Physiology. 1988;64(5):1796–1802. doi: 10.1152/jappl.1988.64.5.1796. [DOI] [PubMed] [Google Scholar]
- 51.Klas JV, Dempsey JA. Voluntary versus reflex regulation of maximal exercise flow: volume loops. American Review of Respiratory Disease. 1989;139(1):150–156. doi: 10.1164/ajrccm/139.1.150. [DOI] [PubMed] [Google Scholar]
- 52.Gandevia B, Hugh-Jones P. Terminology for measurements of ventilatory capacity; a report to the thoracic society. Thorax. 1957;12(4):290–293. doi: 10.1136/thx.12.4.290. [DOI] [PMC free article] [PubMed] [Google Scholar]
- 53.Johnson BD, Reddan WG, Pegelow DF, Seow KC, Dempsey JA. Flow limitation and regulation of functional residual capacity during exercise in a physically active aging population. American Review of Respiratory Disease. 1991;143(5 I):960–967. doi: 10.1164/ajrccm/143.5_Pt_1.960. [DOI] [PubMed] [Google Scholar]
- 54.Johnson BD, Reddan WG, Seow KC, Dempsey JA. Mechanical constraints on exercise hyperpnea in a fit aging population. American Review of Respiratory Disease. 1991;143(5):968–977. doi: 10.1164/ajrccm/143.5_Pt_1.968. [DOI] [PubMed] [Google Scholar]
- 55.Pepe PE, Marini JJ. Occult positive end-expiratory pressure in mechanically ventilated patients with airflow obstruction: the auto-PEEP effect. American Review of Respiratory Disease. 1982;126(1):166–170. doi: 10.1164/arrd.1982.126.1.166. [DOI] [PubMed] [Google Scholar]
- 56.Calverley PMA, Koulouris NG. Flow limitation and dynamic hyperinflation: key concepts in modern respiratory physiology. European Respiratory Journal. 2005;25(1):186–199. doi: 10.1183/09031936.04.00113204. [DOI] [PubMed] [Google Scholar]
- 57.Johnson BD, Scanlon PD, Beck KC. Regulation of ventilatory capacity during exercise in asthmatics. Journal of Applied Physiology. 1995;79(3):892–901. doi: 10.1152/jappl.1995.79.3.892. [DOI] [PubMed] [Google Scholar]
- 58.Johnson BD, Saupe KW, Dempsey JA. Mechanical constraints on exercise hyperpnea in endurance athletes. Journal of Applied Physiology. 1992;73(3):874–886. doi: 10.1152/jappl.1992.73.3.874. [DOI] [PubMed] [Google Scholar]
- 59.Johnson BD, Seow KC, Pegelow DF, Dempsey JA. Adaptation of the inert gas FRC technique for use in heavy exercise. Journal of Applied Physiology. 1990;68(2):802–809. doi: 10.1152/jappl.1990.68.2.802. [DOI] [PubMed] [Google Scholar]
- 60.O’Donnell DE, Laveneziana P. Physiology and consequences of lung hyperinflation in COPD. European Respiratory Review. 2006;15(100):61–67. [Google Scholar]
- 61.D’Angelo E, Prandi E, Marazzini L, Milic-Emili J. Dependence of maximal flow-volume curves on time course of preceding inspiration in patients with chronic obstruction pulmonary disease. American Journal of Respiratory and Critical Care Medicine. 1994;150(6):1581–1586. doi: 10.1164/ajrccm.150.6.7952618. [DOI] [PubMed] [Google Scholar]
- 62.D’Angelo E, Prandi E, Milic-Emili J. Dependence of maximal flow-volume curves on time course of preceding inspiration. Journal of Applied Physiology. 1993;75(3):1155–1159. doi: 10.1152/jappl.1993.75.3.1155. [DOI] [PubMed] [Google Scholar]
- 63.Koulouris NG, Rapakoulias P, Rassidakis A, et al. Dependence of forced vital capacity manoeuvre on time course of preceding inspiration in patients with restrictive lung disease. European Respiratory Journal. 1997;10(10):2366–2370. doi: 10.1183/09031936.97.10102366. [DOI] [PubMed] [Google Scholar]
- 64.Guenette JA, Dominelli PB, Reeve SS, Durkin CM, Eves ND, Sheel AW. Effect of thoracic gas compression and bronchodilation on the assessment of expiratory flow limitation during exercise in healthy humans. Respiratory Physiology and Neurobiology. 2010;170(3):279–286. doi: 10.1016/j.resp.2010.01.017. [DOI] [PubMed] [Google Scholar]
- 65.Murciano D, Ferretti A, Boczkowski J, Sleiman C, Fournier M, Milic-Emili J. Flow limitation and dynamic hyperinflation during exercise in COPD patients after single lung transplantation. Chest. 2000;118(5):1248–1254. doi: 10.1378/chest.118.5.1248. [DOI] [PubMed] [Google Scholar]
- 66.Koulouris NG, Dimopoulou I, Valta P, Finkelstein R, Cosio MG, Milic-Emili J. Detection of expiratory flow limitation during exercise in COPD patients. Journal of Applied Physiology. 1997;82(3):723–731. doi: 10.1152/jappl.1997.82.3.723. [DOI] [PubMed] [Google Scholar]
- 67.Kosmas EN, Milic-Emili J, Polychronaki A, et al. Exercise-induced flow limitation, dynamic hyperinflation and exercise capacity in patients with bronchial asthma. European Respiratory Journal. 2004;24(3):378–384. doi: 10.1183/09031936.04.00113003. [DOI] [PubMed] [Google Scholar]
- 68.Dawson SV, Elliott EA. Wave speed limitation on expiratory flow-a unifying concept. Journal of Applied Physiology Respiratory Environmental and Exercise Physiology. 1977;43(3):498–515. doi: 10.1152/jappl.1977.43.3.498. [DOI] [PubMed] [Google Scholar]
- 69.Hyatt RE. Expiratory flow limitation. Journal of Applied Physiology Respiratory Environmental and Exercise Physiology. 1983;55(1):1–7. doi: 10.1152/jappl.1983.55.1.1. [DOI] [PubMed] [Google Scholar]
- 70.O’Donnell DE, D’Arsigny C, Fitzpatrick M, Webb KA. Exercise hypercapnia in advanced chronic obstructive pulmonary disease: the role of lung hyperinflation. American Journal of Respiratory and Critical Care Medicine. 2002;166(5):663–668. doi: 10.1164/rccm.2201003. [DOI] [PubMed] [Google Scholar]
- 71.O’Donnell DE, Revill SM, Webb KA. Dynamic hyperinflation and exercise intolerance in chronic obstructive pulmonary disease. American Journal of Respiratory and Critical Care Medicine. 2001;164(5):770–777. doi: 10.1164/ajrccm.164.5.2012122. [DOI] [PubMed] [Google Scholar]
- 72.O’Donnell DE, Lam M, Webb KA. Measurement of symptoms, lung hyperinflation, and endurance during exercise in chronic obstructive pulmonary disease. American Journal of Respiratory and Critical Care Medicine. 1998;158(5):1557–1565. doi: 10.1164/ajrccm.158.5.9804004. [DOI] [PubMed] [Google Scholar]
- 73.O’Donnell DE, Bertley JC, Chau LKL, Webb KA. Qualitative aspects of exertional breathlessness in chronic airflow limitation: pathophysiologic mechanisms. American Journal of Respiratory and Critical Care Medicine. 1997;155(1):109–115. doi: 10.1164/ajrccm.155.1.9001298. [DOI] [PubMed] [Google Scholar]
- 74.O’Donnell DE, Hamilton AL, Webb KA. Sensory-mechanical relationships during high-intensity, constant-work-rate exercise in COPD. Journal of Applied Physiology. 2006;101(4):1025–1035. doi: 10.1152/japplphysiol.01470.2005. [DOI] [PubMed] [Google Scholar]
- 75.Laveneziana P, Webb KA, Ora J, Wadell K, O’Donnell DE. Evolution of dyspnea during exercise in chronic obstructive pulmonary disease: impact of critical volume constraints. American Journal of Respiratory and Critical Care Medicine. 2011;184(12):1367–1373. doi: 10.1164/rccm.201106-1128OC. [DOI] [PubMed] [Google Scholar]
- 76.O’Donnell DE, Guenette JA, Maltais F, Webb KA. Decline of resting inspiratory capacity in COPD: the impact on breathing pattern, dyspnea, and ventilatory capacity during exercise. Chest. 2012;141(3):753–762. doi: 10.1378/chest.11-0787. [DOI] [PubMed] [Google Scholar]
- 77.Guenette JA, Webb KA, O’Donnell DE. Does dynamic hyperinflation contribute to dyspnoea during exercise in patients with COPD? European Respiratory Journal. 2012;40(2):322–329. doi: 10.1183/09031936.00157711. [DOI] [PubMed] [Google Scholar]
- 78.Stubbing DG, Pengelly LD, Morse JLC, Jones NL. Pulmonary mechanics during exercise in subjects with chronic airflow obstruction. Journal of Applied Physiology Respiratory Environmental and Exercise Physiology. 1980;49(3):511–515. doi: 10.1152/jappl.1980.49.3.511. [DOI] [PubMed] [Google Scholar]
- 79.Marciniuk DD, Sridhar G, Clemens RE, Zintel TA, Gallagher CG. Lung volumes and expiratory flow limitation during exercise in interstitial lung disease. Journal of Applied Physiology. 1994;77(2):963–973. doi: 10.1152/jappl.1994.77.2.963. [DOI] [PubMed] [Google Scholar]
- 80.Yan S, Kaminski D, Sliwinski P. Reliability of inspiratory capacity for estimating end-expiratory lung volume changes during exercise in patients with chronic obstructive pulmonary disease. American Journal of Respiratory and Critical Care Medicine. 1997;156(1):55–59. doi: 10.1164/ajrccm.156.1.9608113. [DOI] [PubMed] [Google Scholar]
- 81.Aliverti A, Stevenson N, Dellacà RL, Lo Mauro A, Pedotti A, Calverley PMA. Regional chest wall volumes during exercise in chronic obstructive pulmonary disease. Thorax. 2004;59(3):210–216. doi: 10.1136/thorax.2003.011494. [DOI] [PMC free article] [PubMed] [Google Scholar]
- 82.Clarenbach CF, Senn O, Brack T, Kohler M, Bloch KE. Monitoring of ventilation during exercise by a portable respiratory inductive plethysmograph. Chest. 2005;128(3):1282–1290. doi: 10.1378/chest.128.3.1282. [DOI] [PubMed] [Google Scholar]
- 83.Hsia CCW. Recruitment of lung diffusing capacity: update of concept and application. Chest. 2002;122(5):1774–1783. doi: 10.1378/chest.122.5.1774. [DOI] [PubMed] [Google Scholar]
- 84.Johnson RL, Jr, Spicer WS, Bishop JM, Forster RE. Pulmonary capillary blood volume, flow and diffusing capacity during exercise. Journal of Applied Physiology. 1960;15:893–902. doi: 10.1152/jappl.1960.15.5.893. [DOI] [PubMed] [Google Scholar]
- 85.Tamhane RM, Johnson RL, Jr, Hsia CCW. Pulmonary membrane diffusing capacity and capillary blood volume measured during exercise from nitric oxide uptake. Chest. 2001;120(6):1850–1856. doi: 10.1378/chest.120.6.1850. [DOI] [PubMed] [Google Scholar]
- 86.Hsia CCW, Wagner PD, Dane DM, Wagner HE, Johnson RL., Jr Predicting diffusive alveolar oxygen transfer from carbon monoxide-diffusing capacity in exercising foxhounds. Journal of Applied Physiology. 2008;105(5):1441–1447. doi: 10.1152/japplphysiol.01328.2007. [DOI] [PMC free article] [PubMed] [Google Scholar]
- 87.Fisher JT, Cerny FJ. Characteristics of adjustment of lung diffusing capacity to work. Journal of Applied Physiology Respiratory Environmental and Exercise Physiology. 1982;52(5):1124–1127. doi: 10.1152/jappl.1982.52.5.1124. [DOI] [PubMed] [Google Scholar]
- 88.Hsia CCW, McBrayer DG, Ramanathan M. Reference values of pulmonary diffusing capacity during exercise by a rebreathing technique. American Journal of Respiratory and Critical Care Medicine. 1995;152(2):658–665. doi: 10.1164/ajrccm.152.2.7633723. [DOI] [PubMed] [Google Scholar]
- 89.Hopkins SR. Exercise induced arterial hypoxemia: the role of ventilation-perfusion inequality and pulmonary diffusion limitation. Advances in Experimental Medicine and Biology. 2006;588:17–30. doi: 10.1007/978-0-387-34817-9_3. [DOI] [PubMed] [Google Scholar]
- 90.Hammond MD, Gale GE, Kapitan KS. Pulmonary gas exchange in humans during exercise at sea level. Journal of Applied Physiology. 1986;60(5):1590–1598. doi: 10.1152/jappl.1986.60.5.1590. [DOI] [PubMed] [Google Scholar]
- 91.Hopkins SR, McKenzie DC, Schoene RB, Glenny RW, Robertson HT. Pulmonary gas exchange during exercise in athletes I. Ventilation- perfusion mismatch and diffusion limitation. Journal of Applied Physiology. 1994;77(2):912–917. doi: 10.1152/jappl.1994.77.2.912. [DOI] [PubMed] [Google Scholar]
- 92.Rice AJ, Thornton AT, Gore CJ, et al. Pulmonary gas exchange during exercise in highly trained cyclists with arterial hypoxemia. Journal of Applied Physiology. 1999;87(5):1802–1812. doi: 10.1152/jappl.1999.87.5.1802. [DOI] [PubMed] [Google Scholar]
- 93.Wagner PD, Gale GE, Moon RE. Pulmonary gas exchange in humans exercising at sea level and simulated altitude. Journal of Applied Physiology. 1986;61(1):260–270. doi: 10.1152/jappl.1986.61.1.260. [DOI] [PubMed] [Google Scholar]
- 94.Stickland MK, Lovering AT. Exercise-induced intrapulmonary arteriovenous shunting and pulmonary gas exchange. Exercise and Sport Sciences Reviews. 2006;34(3):99–106. doi: 10.1249/00003677-200607000-00003. [DOI] [PubMed] [Google Scholar]
- 95.Stickland MK, Welsh RC, Haykowsky MJ, et al. Intra-pulmonary shunt and pulmonary gas exchange during exercise in humans. Journal of Physiology. 2004;561(1):321–329. doi: 10.1113/jphysiol.2004.069302. [DOI] [PMC free article] [PubMed] [Google Scholar]
- 96.Powers SK, Dodd S, Freeman J, Ayers GD, Samson H, McKnight T. Accuracy of pulse oximetry to estimate HbO2 fraction of total Hb during exercise. Journal of Applied Physiology. 1989;67(1):300–304. doi: 10.1152/jappl.1989.67.1.300. [DOI] [PubMed] [Google Scholar]
- 97.Yamaya Y, Bogaard HJ, Wagner PD, Niizeki K, Hopkins SR. Validity of pulse oximetry during maximal exercise in normoxia, hypoxia, and hyperoxia. Journal of Applied Physiology. 2002;92(1):162–168. doi: 10.1152/japplphysiol.00409.2001. [DOI] [PubMed] [Google Scholar]
- 98.Smyth RJ, D’Urzo AD, Slutsky AS. Ear oximetry during combined hypoxia and exercise. Journal of Applied Physiology. 1985;60(2):716–719. doi: 10.1152/jappl.1986.60.2.716. [DOI] [PubMed] [Google Scholar]
- 99.Salzman S. Cardiopulmonary exercise testing. ACCP Pulmonary Board Review. 2003:363–381. [Google Scholar]
- 100.Myers J, Prakash M, Froelicher V, Do D, Partington S, Edwin Atwood J. Exercise capacity and mortality among men referred for exercise testing. New England Journal of Medicine. 2002;346(11):793–801. doi: 10.1056/NEJMoa011858. [DOI] [PubMed] [Google Scholar]