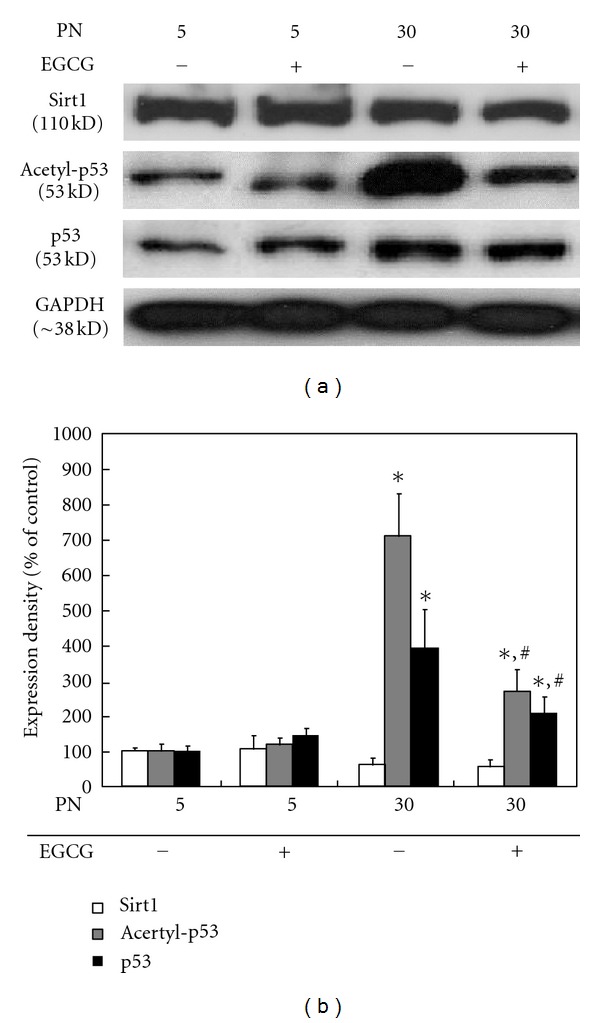
Figure 3.

Effects of EGCG on Sirt1, acetylated p53, and p53 expression in serially passaged HDFs. After treatment with 100 μM EGCG, the expression levels of Sirt1, acetylated p53, and p53 (a) were determined by western blotting as described in Section 2. Results from representative experiments were normalized to GAPDH expression by densitometry. The quantitative result (b) is shown below. All variables were tested in three independent cultures for each experiment, which was repeated twice independently (n = 6). The results are reported as a mean ± SD and analyzed by a Tukey HSD test. *P < 0.05 versus nontreated cells of 5 PN; # P < 0.05 versus nontreated cells of 30 PN.
