
Figure 6.
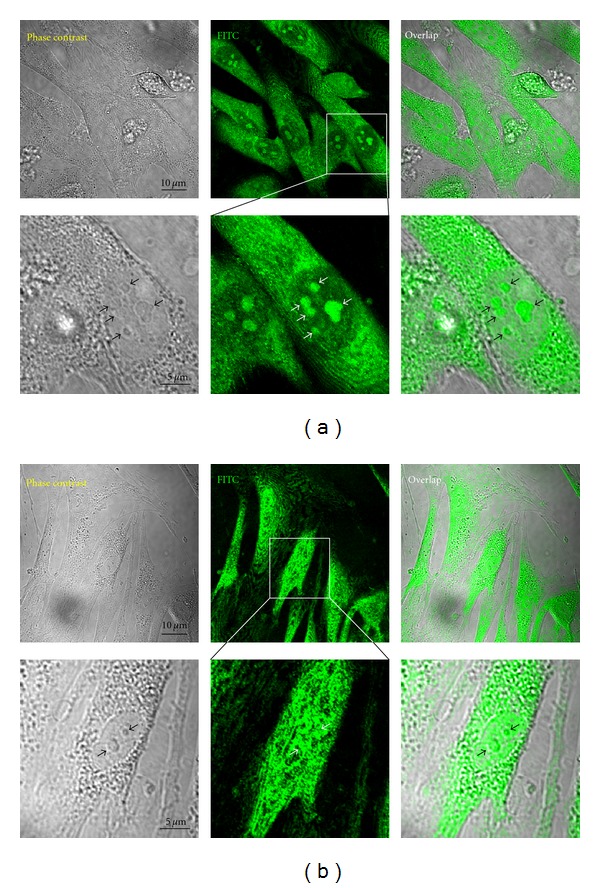
Differential cellular uptake of FITC-EGCG in proliferating (PN 5) (a) versus senescent (PN 30) (b) HDFs. Cells were incubated with 100 μM FITC-EGCG for 8 h and then observed under a confocal laser scanning microscope. The micrographs shown in this figure are representative of six independent experiments, showing similar results (original magnification: ×500 and ×2000 ((a) and (b), resp.,)). Arrows in this figure indicate endosome-like structures, where FITC-EGCG was bound for translocation into the nucleus.