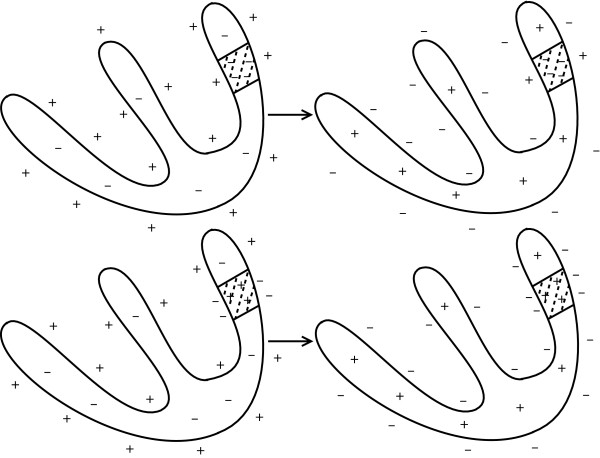
Figure 2.
Cause of ST segment deviation [[1]]. Left column shows distribution of electric charges before the ventricles contracts. The right column shows the charge distribution after the ventricles contracted. Shaded area represents that the area was affected by ischemia.

