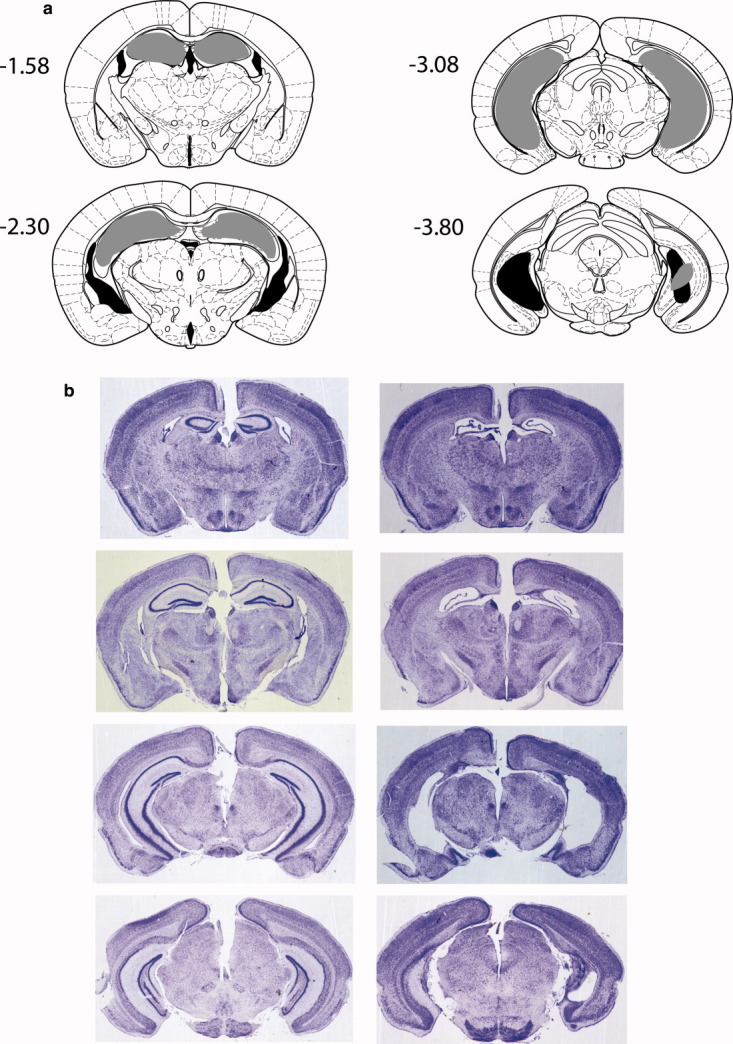
Figure 2.

(a) Coronal sections (Franklin and Paxinos, 2001) of the hippocampus depicting the largest (black) and smallest (gray) hippocampal lesions. The numbers refer to the distance (in mm) posterior to bregma. (b) Photomicrographs of four coronal sections from a control brain (left) and a representative hippocampal lesion (right) in C57BL/6J/Ola mice. The sections (40 μm thick) correspond approximately to points (from top to bottom) −1.58, −2.30, −3.08, and −3.80 mm from bregma. [Color figure can be viewed in the online issue, which is available at wileyonlinelibrary.com.]
