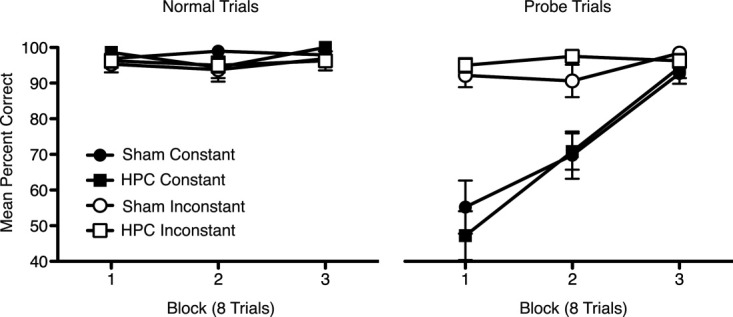
Figure 5.

Mean percent correct (±S.E.M.) in probe test 1, Experiment 1. Performance is shown in blocks of eight trials (two sessions) per trial type (normal trials, probe trials). Performance on the normal trials is shown on the left and performance on the probe trials in shown on the right. Both sham and hippocampal lesioned mice in Group Constant (black circles and squares, respectively) performed significantly worse on the probe trials than on the normal trials. Sham and hippocampal lesion mice in Group Inconstant (white circles and squares, respectively) showed a high level of performance on both trials types.
