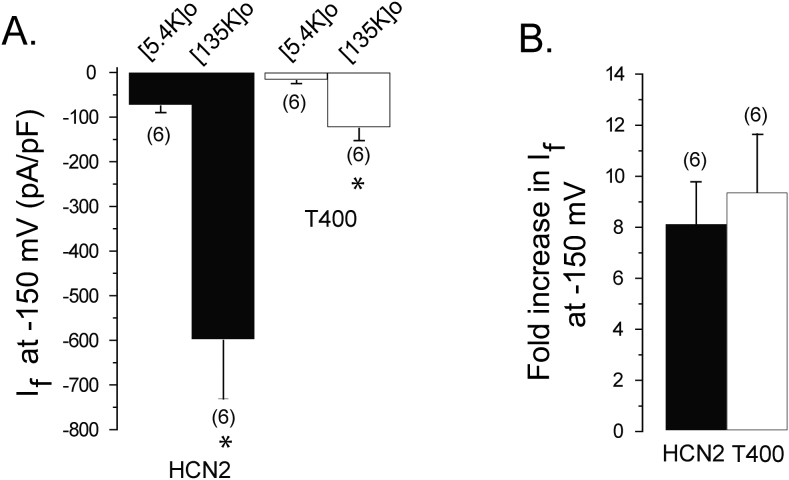
Figure 3. The T400 mutation has no effect on the degree of current enhancement by extracellular potassium.
(A) Bar graph comparing wild type and T400 steady-state current density, in low (5.4 mM) and high (135 mM) concentrations of extracellular potassium, measured in the same cells in response to test pulses at −150 mV, elicited from a holding potential of −35 mV. The intracellular solution contained 130 mM K+ and 10 mM NMG. Asterisks denote significant difference between current density in low versus high extracellular potassium solutions (t-test, p<0.05). (B) Bar graph comparing the relative increase in current density of wild type and T400 when raising extracellular potassium from a low (5.4 mM K+/135 mM NMG) to high (135 mM K+/5.4 mM NMG) concentrations, from “A”. There was no significant difference between in the fold-increase between wild type and mutant channels (t-test, p>0.05). For both “A” and “B”, the numbers in parentheses represent the number of cells measured.

