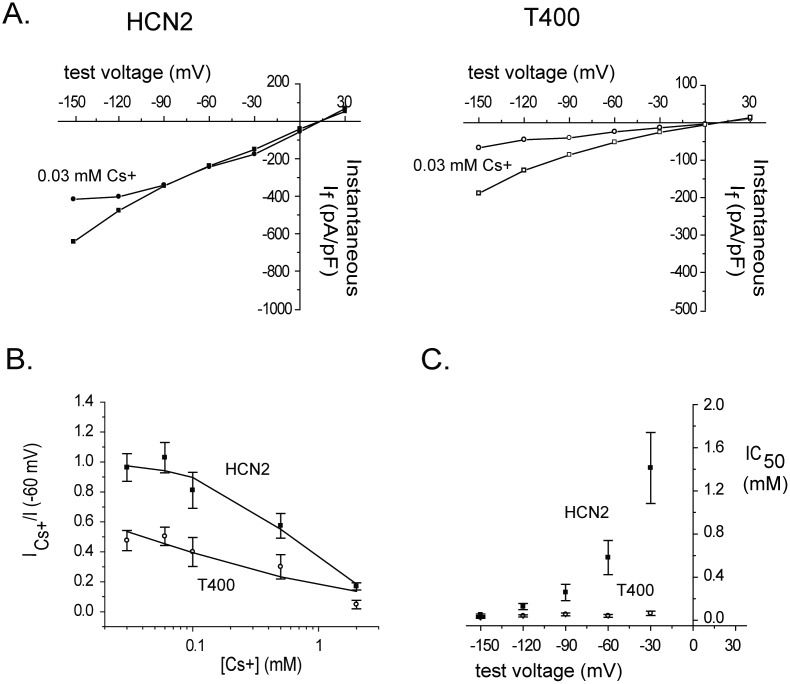
Figure 5. Compared to its effect on the wild type HCN2 channel extracellular Cs+ blocks the T400 channel with greater sensitivity and lesser dependence on voltage.
(A) Plots of instantaneous If versus voltage in cells expressing HCN2 or T400, determined using the voltage protocol and analysis described in Fig. 1, before and during perfusion with 0.03 mM Cs+ with 135 mM K+ and 5.4 mM Na+ in the extracellular solution and 130 mM K+ and 10 mM Na+ in the intracellular solution (HCN2, filled squares, HCN2 + Cs+, filled circles, n = 5 cells; T400 open squares, T400 + Cs+, open circles, n = 6 cells). This type of experiment was carried out for a range of Cs+ concentrations and test voltages, from which the ratio of blocked current was determined and plotted against Cs+ concentration (example for −60 mV shown in “B”, below). (B) Plot of the ratio of blocked current at −60 mV, obtained from instantaneous If-V curves as shown in “A”, versus Cs+ concentration, for HCN2 (filled squares) and T400 (open circles). The values for the ratio of blocked current represent means ± s.e.m. Solid lines represent fits of the data with the Hill equation (Equation 2), which gave values for IC50 and Hill factor (n); this analysis was carried out for a range of test voltages from which IC50 values were obtained and plotted against voltage (“C”, below). (C) Plot of IC50 values, obtained from Hill plots as determined in “B”, versus test voltage for HCN2 (filled squares) and T400 (open circles) channels. The IC50 values represent means ± s.e.m.

