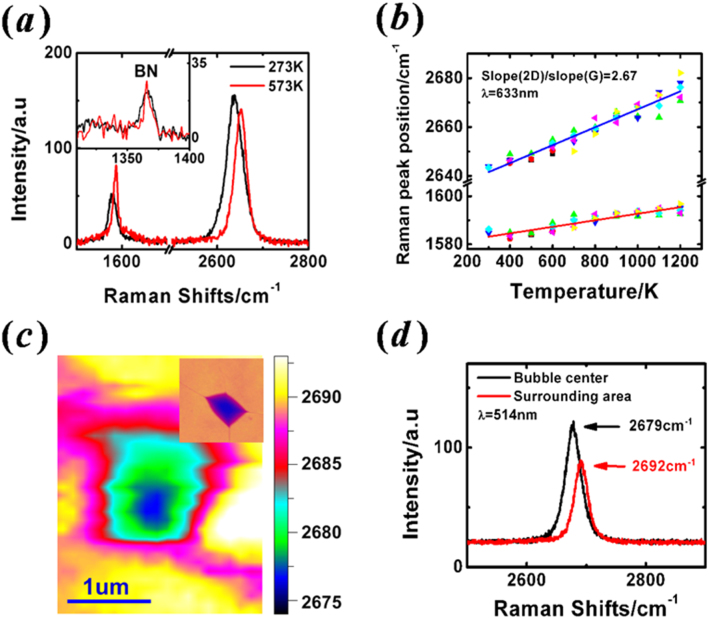
Figure 2.
(a) Raman spectra of the same GBN before and after 300C annealing.The inset compares the Raman peak of BN before and after annealing. The shifts in G and 2D peaks are not caused by system error as the BN peaks line up nicely for the two scans. We also carefully calibrated the spectrometer for each measurement. (b) Averaged G and 2D peaks positions of seven GBN samples as a function of annealing temperature. Solid lines are linear fittings of the data. The ratio between the linear temperature coefficient of 2D and G peak is 2.67. (c) A Raman mapping of 2D peak position near a graphene bubble with a 514 nm laser excitation. The bubble forms after annealing at 100°C. Inset shows the AFM of the bubble, sharing the same scale bar with (c). (d) The averaged Raman spectra taken at the bubble center and surrounding area from (c).

