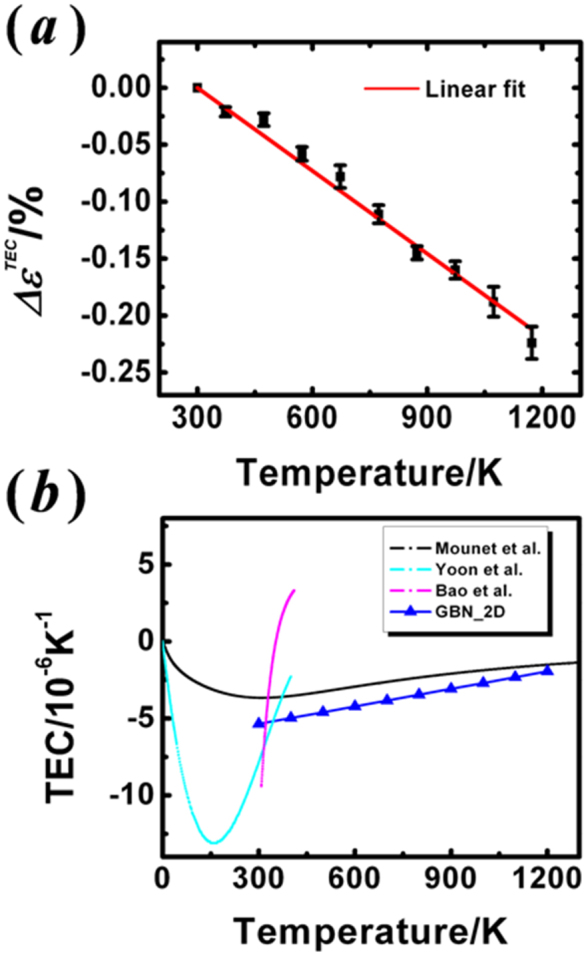
Figure 4.

(a)  as a function of temperature derived from the 2D peak shifts in Fig.2b. The red line shows linear fitting. (b) The temperature-dependent TEC of graphene derived from
  , together with earlier theoretical and experimental results. The blue symbols are obtained from 2D peak shift in the present work (G peak shift gives similar results). The black line denotes the first-principle simulation results in Ref. 29. The purple and light blue lines denote the fitting of experimental values reported in Ref. 17 and 18 respectively.
