Figure 3.

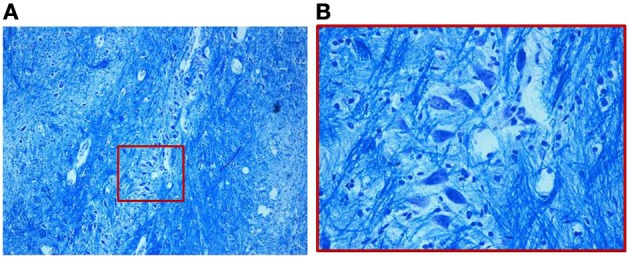
(A) Organization of the MSO in a 2-month-old infant of the control group. The neurons, as shown in the magnified boxed area (B), are fusiform with prevalently similar orientation. Klüver–Barrera stain. Magnification: (A) 10×; (B) 40×.

(A) Organization of the MSO in a 2-month-old infant of the control group. The neurons, as shown in the magnified boxed area (B), are fusiform with prevalently similar orientation. Klüver–Barrera stain. Magnification: (A) 10×; (B) 40×.