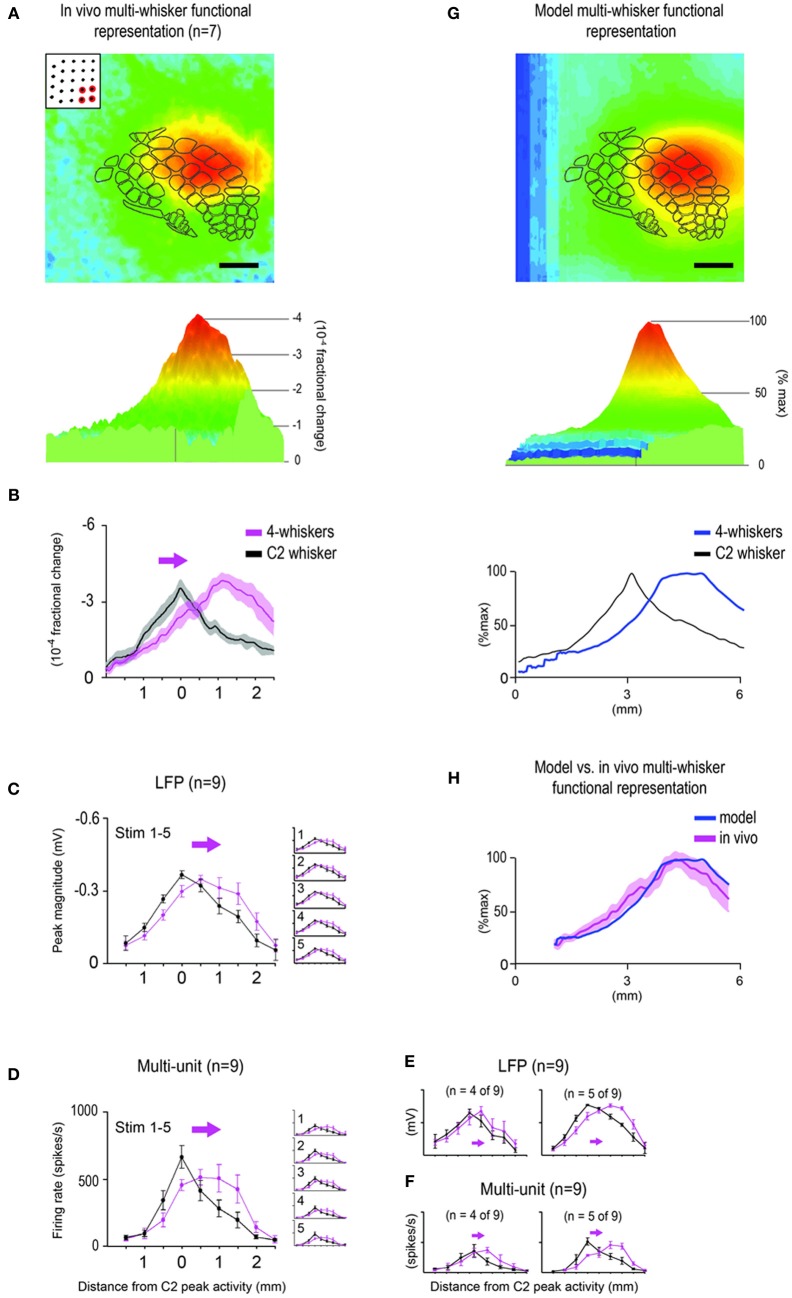
Figure 6.
Subset of 4 whiskers also evokes an activity mountain with a single central peak that can be predicted by modeling. The multi-whisker functional representation (MWFR) for the 4-whiskers array (D3, D4, E3, and E4) was assessed in vivo using intrinsic signal optical imaging (n = 7; A–B) and supra- and sub-threshold neuronal recordings from an 8-electrode array (n = 9; C–F), and compared to modeling based on linear summation of single whisker functional representations (G–H). Details are the same as described in Figures 3–4 except the MWFR is for 4-whiskers instead of 24-whiskers. Note for both imaging (A,B) and neuronal recording (C,D) data, the MWFR for the 4-whiskers array consisted of a single peak located centrally within a large activation spread, thus resembling a relatively symmetrical activity mountain with one peak. Also, compared to the single whisker C2, the 24-whiskers' MWFR exhibited a shift in location of peak activity (see arrow in B–D), similar peak magnitude, and similar tangential spread of activity and thus a similarly broad mountain of activity. Although the activity mountain for the 4-whiskers appeared less peaked compared to C2 whisker, particularly for the supra-threshold activity (D), once sub- (C) and supra- (D) threshold neuronal activity for 4-whiskers were subdivided into two groups according to whether the peak location for 4-whiskers shifted by one (n = 4 out of 9 rats; left panels in E,F) or two (n = 5 out of 9 rats; right panels in E,F) electrode recording locations, the spatial profile for 4-whiskers no longer appeared less peaked compared to whisker C2. Last, the model-MWFR exhibited many of the salient properties observed for the in vivo-MWFR: symmetrical activity mountain with one central peak (G, middle panel), peak location shifted away from that for whisker C2 (G, bottom panel) and thus located off-centered within barrel cortex (G, top panel), a relatively similar broad activity mountain compared to whisker C2 (G, bottom panel), ultimately leading to a high goodness-of-fit with data obtained in vivo (H).

