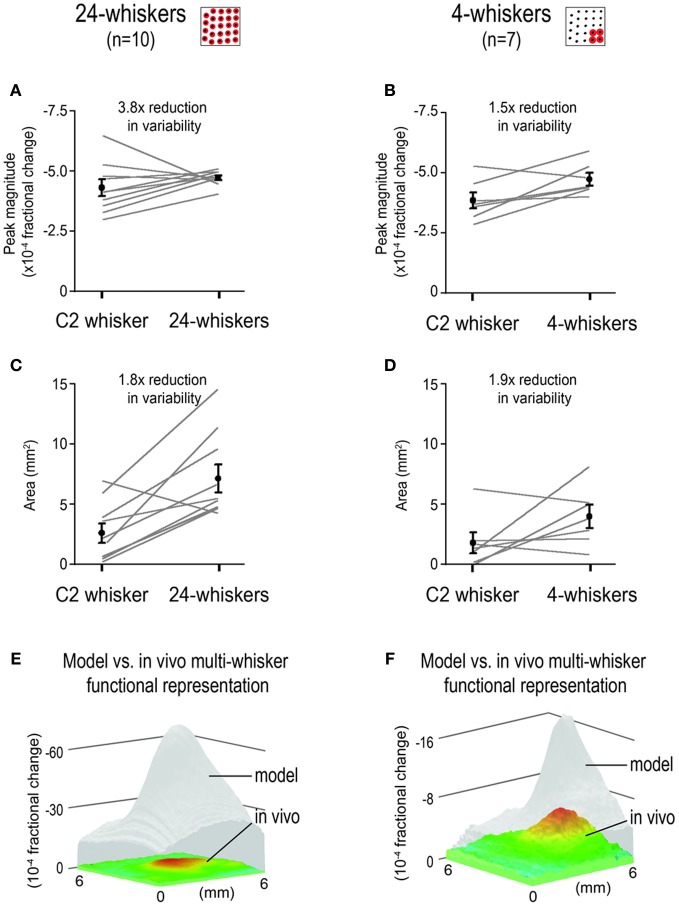
Figure 7.
Reduction in variability of response properties for multi-whisker functional representations (MWFRs) compared to single whisker functional representation (SWFR). Individual and mean ± SE values of MWFR peak magnitude (A,B) and area (C,D) for 24-whiskers (A,C) and 4-whiskers (B,D) are provided. For both sets of rats, values for whisker C2 SWFR are obtained within the same animals. Area is quantified using a constant threshold of 2.5 × 10⁻⁴ fractional change; peak magnitude is from the pixel location with the peak activity. The coefficient of variation (ratio between mean and variance) is used as a measure of degree in response variability. Note the reduction in response variability for the MWFRs as compared to the SWFR for whisker C2, particularly apparent for the peak magnitude of the 24-whiskers MWFR in panel (A). (E,F) Activity mountains plotted on the same z-scale range to illustrate that the MWFR obtained in vivo (color) is much weaker than predicted by modeling based on simple linear summation (transparent gray).

