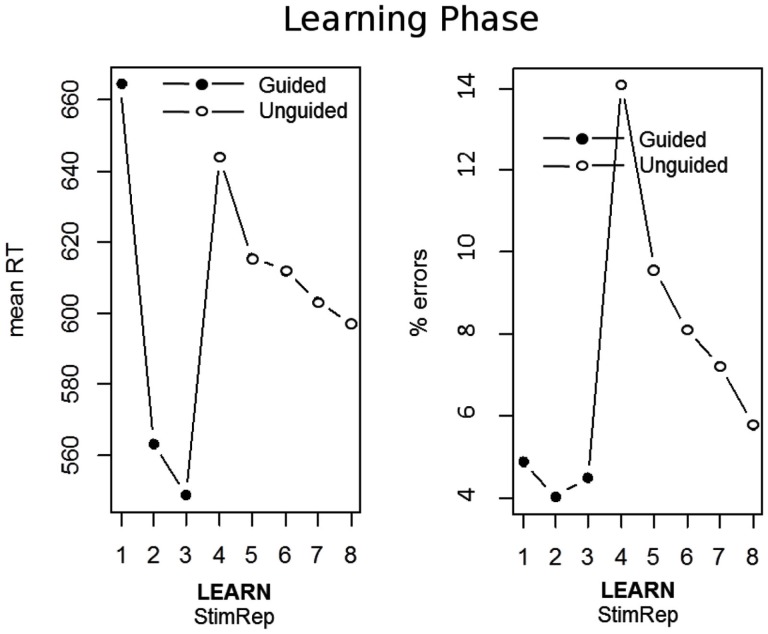
Figure 4.
Performance across the initial learning phase of Exp. 2A and Exp. 2B averaged together. The left panel depicts mean response times (RT) and the right panel depicts mean% errors. Learning is expressed in terms of correctly implemented stimulus repetitions (StimRep). The first 3 stimulus repetitions were guided by an instructional stimulus (IS) whereas the remaining 5 stimulus repetitions where unguided. RTs for StimRep 1–3 are measured relative to the IS onset whereas RTs for StimRep 4–8 are measured relative to the stimulus itself.

