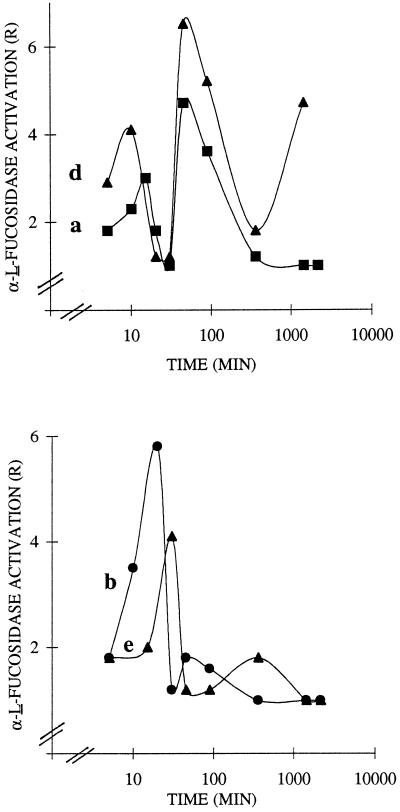
Figure 3.
Time course for α-l-fucosidase activation in R. fruticosus protoplasts challenged with the sugar inducers XXLGol (a), XXFGol (b), and XXXGol (d) and the trisaccharide methyl α-1-Fuc-(1→2)-β-d-Gal-(1→2)-β-d-Xyl (e). Protoplasts (2 × 10⁶) in 25 mL of buffer were challenged with inducer used at the optimal concentration (0.1 nm XXXGol, 1 nm XXFGol, 5 nm XXLGol, and 10 nm trisaccharide). Each curve was obtained by least-squares regression of data from three to four replications carried out from three independent inducer sets. R is reported as the rate of α-l-fucosidase activity of treated over control protoplasts. Control sets were run without addition of 2,4-D or oligosaccharides.

