Figure 3.

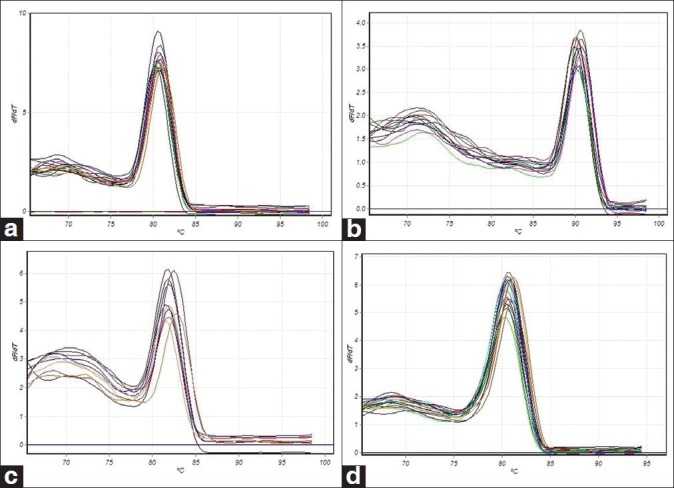
Melting curve analysis. (a) Beta actin, (b) Osteocalcin, (c) Osteopontin, (d) Cbfa1. Normally plotted with fluorescence on the Y-axis and temperature on the X-axis

Melting curve analysis. (a) Beta actin, (b) Osteocalcin, (c) Osteopontin, (d) Cbfa1. Normally plotted with fluorescence on the Y-axis and temperature on the X-axis