
Figure 1a.
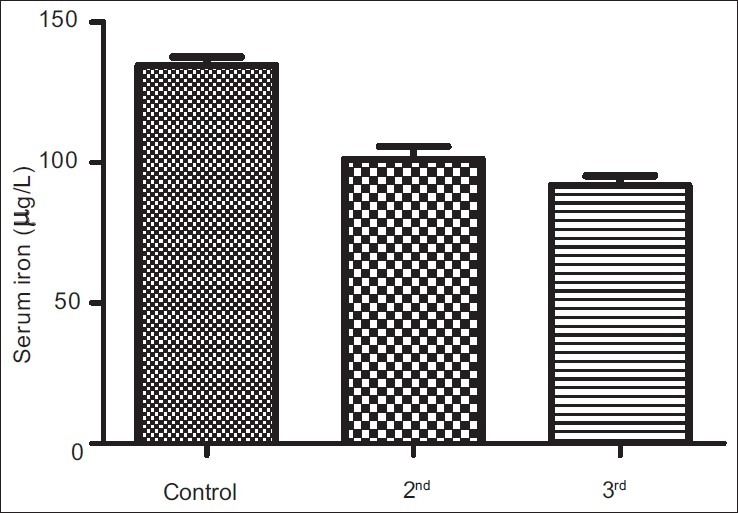
Bar chart showing means (SEMs) of serum iron concentrations in controls, second and third trimesters
Official websites use .gov
A
.gov website belongs to an official
government organization in the United States.
Secure .gov websites use HTTPS
A lock (
) or https:// means you've safely
connected to the .gov website. Share sensitive
information only on official, secure websites.
Bar chart showing means (SEMs) of serum iron concentrations in controls, second and third trimesters