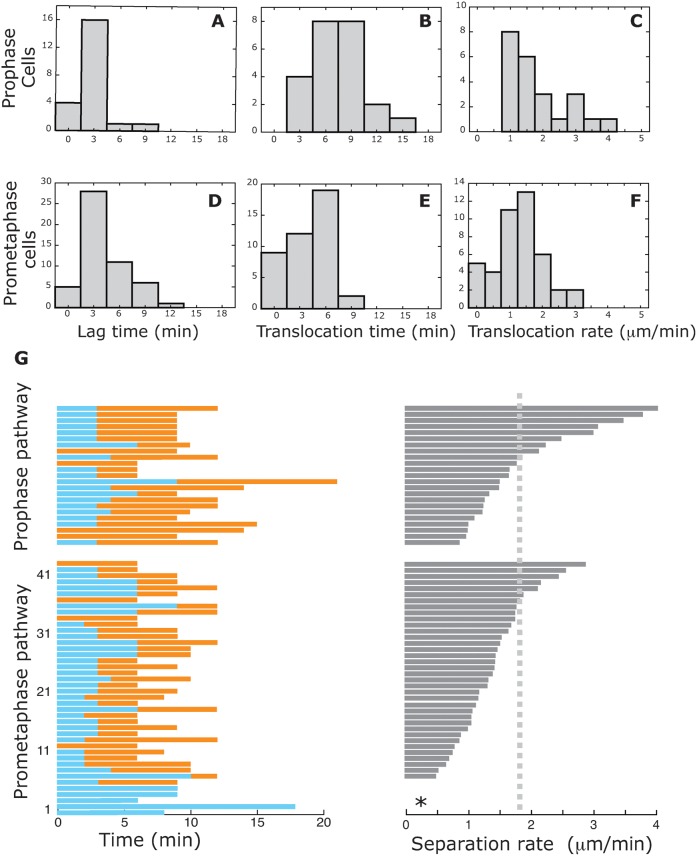
Fig. 2. Centrosome movement in the prophase and prometaphase pathways.
Lag time (A and D), translocation time (B and E) and centrosome separation rate (C and F) for prophase (A to C) and prometaphase pathways (D to F). Centrosome separation rate was measured only whilst the two centrosomes were moving within the optical plane corresponding to the underside of the nucleus. In the prophase pathway, the mean lag time, translocation time and separation rate are 3.0±2.0 min SD (n=22), 7.4±3.0 min (n=22) and, 1.8±0.9 µm/min (n=23), respectively. In the prometaphase pathway, these parameters are 4.1±2.8 min (n=51), 4.1±2.6 min (n=42) and 1.3±0.7 µm/min (n=43). (G) Individual cell histories for prophase pathway (above) and prometaphase pathway (below) cells. Each horizontal bar represents one cell. Lag time (cyan bar), translocation time (orange bar) and centrosome separation rate (grey bar) are plotted for each cell. The records are shown sorted in order of separation rate. The dotted line shows the average velocity (1.8 µm/min) of prophase pathway cells. Data are mean ± SD.

