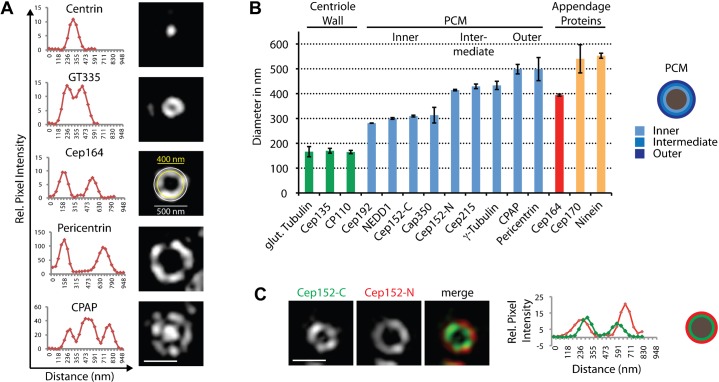
Fig. 2. Centrosomal proteins display distinct localizations and radial distances from centriole walls.
U2OS cells were fixed and stained with the indicated antibodies. Scale bar 0.5 µm. (A) Exemplary top-views of proteins localizing to centrioles in different patterns, along with intensity plots. In the middle panel (Cep164) rings corresponding to diameters of 400 and 500 nm are depicted. (B) For quantification, distances between intensity maxima were measured (mean ± sd) (see also Table 1). Proteins were grouped according to average ring diameter and centriole localization. Schematic of cross-section of mother centriole is given on the right to illustrate subdivision into inner, intermediate and outer PCM. (C) Staining of centrioles with antibodies against the N- or C-termini of Cep152 reveals distinct distances from the centriole wall. Representative images and the corresponding intensity plots along with a schematic illustration of centriolar cross-section are shown.

