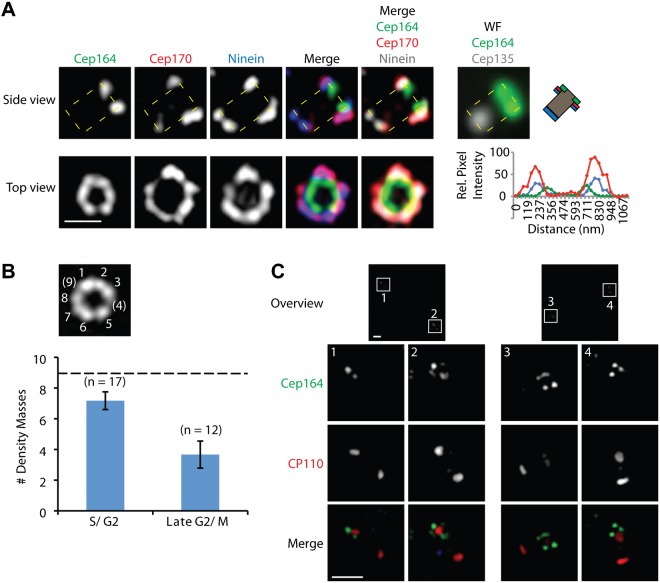
Fig. 3. Localization of centriolar appendage proteins.
U2OS cells were fixed and stained with the indicated antibodies and images were acquired with 3D-SIM. (A) Relative localization of distal and subdistal appendage proteins. Shown are side-view (a single stack, upper panel, boxed area indicates centriole) and top-view images (lower panel) of a representative centriole. Also shown are correlative wide-field (WF) images of the green (Cep164) and far-red (Cep135) channels of the same centriole that is visualized in side-view, along with a schematic representation to illustrate the orientation of the centriole. Intensity plots of Cep164, Cep170 and Ninein are given for the top-view. Scale bar 0.5 µm. (B,C) Staining for Cep164 reveals distinct density masses. The number of these masses is lower in G2/M cells (after centrosome separation) than in S/G2 cells (before centrosome separation). Panel B shows a representative image of a centriole in S/G2 phase; panel C shows two examples of centrioles in late G2/M phase. Scale bars 1 µm.

