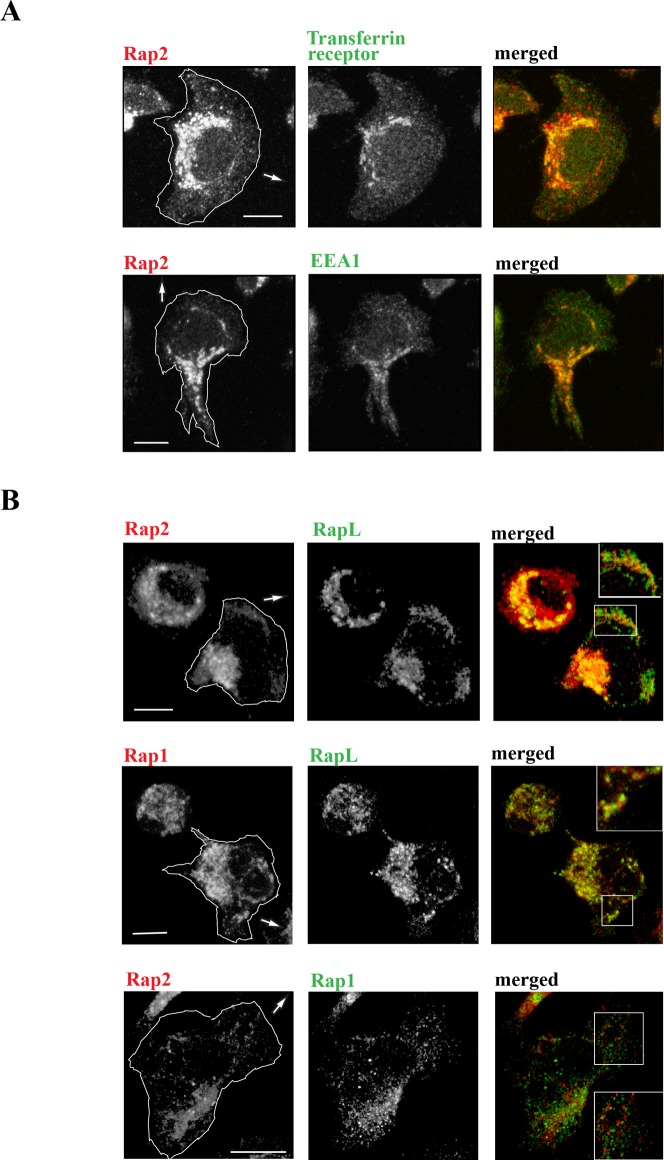
Fig. 3. Expression of Rap2, Rap1 and recycling vesicles in migrating T lymphoblasts.
(A) Confocal microscopy images showing the co-distribution of Rap2 with intracellular vesicle markers EEA1 and transferrin receptor at the interface with ICAM-1. (B) Rap2 and Rap1 each co-localize with effector RAPL, but there is a lack of overlap between these two GTPases; insets show detail at leading edge. Arrows show direction of T cell migration. Scale bar = 5 µm.

