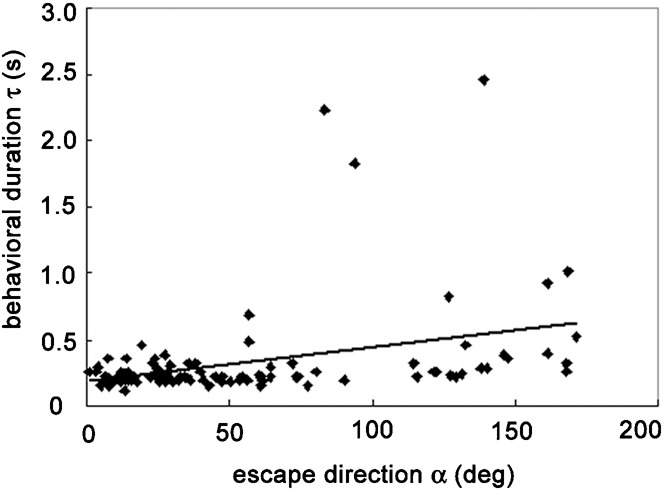
Fig. 3. Scatter plot showing a correlation between the escape direction α and behavioral duration τ of the escape behavior (r2 = 0.118).

Data points obtained from right turns are shown as they would appear after reflection around the mid sagittal plane. The slope of the regression line is 0.0026 s/deg, suggesting almost constant behavioral duration.
