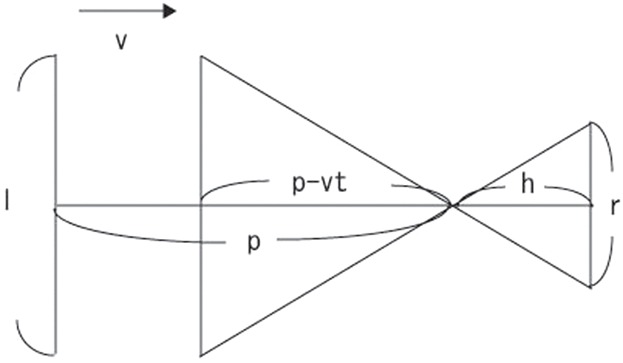
Fig. 7. The stimulus simulated a black square approaching at a constant speed v with size l through a path of p.

The threshold of the stimulus size on the screen placed h above the experimental stage was calculated by the equation, r = hl/(p − vt), where t denotes the delay between the onset of stimulus and the time when the frog start to move.
