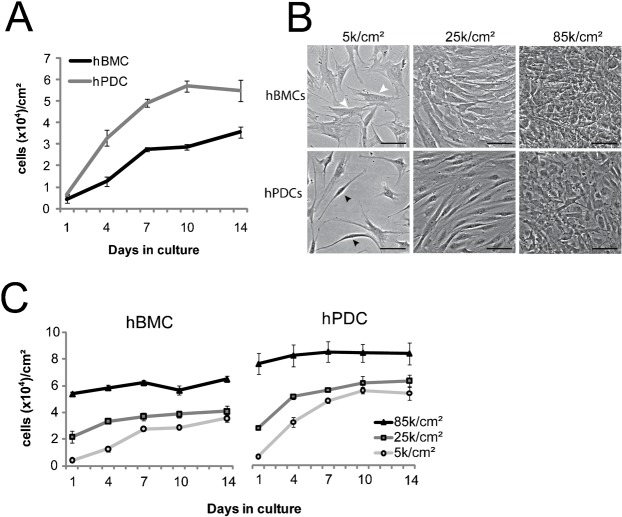
Fig. 1. Morphological and growth characterization of hBMCs and hPDCs.
(A) Growth curves of hBMCs (human bone marrow-derived cells) and hPDCs (human periosteum-derived cells) over 2 weeks in culture. (B) Phase contrast images of hBMCs and hPDCs at one day after seeding at 5 k/cm2, 25 k/cm2, and 85 k/cm2 (scale bar = 100 µm). White arrowheads indicate flattened morphology whereas black arrowheads indicate spindle-shaped morphology. (C) Growth kinetics of hBMCs (2 donors/2 experiments) and hPDCs (4 donors) seeded at different densities from passage 4. All error bars indicate standard error of the mean (n = 3 hBMC donors or 4 hPDC donors).

