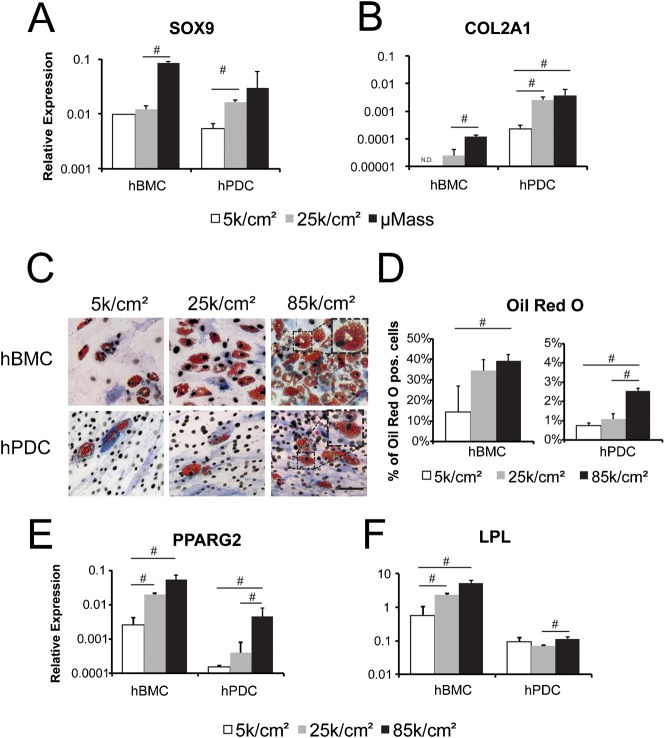
Fig. 2. Chondrogenic differentiation and adipogenic differentiation are modulated by cell seeding density in hPDCs and hBMCs.
Gene expression of SOX9 (A) and COL2A1 (B), relative to GAPDH expression, in hBMCs and hPDCs seeded at 5 k/cm2, 25 k/cm2, or as a micromass (μMass, 400 k/20 µl) and stimulated for 14 days with chondrogenic medium. (C) Oil Red O staining of hBMCs and hPDCs seeded at indicated cell densities and treated for two weeks with adipogenic medium (scale bar = 100 µm). (D) Quantification of Oil Red O (ORO) positive cells relative to total cells as indicated by DAPI nuclear staining. Gene expression of PPARG2 (E) and LPL (F), relative to GAPDH expression, for hBMCs and hPDCs seeded at the indicated cell densities and cultured for two weeks in adipogenic medium. Relative gene expression values are shown as 2−ΔCT (where ΔCT = CT value for Gene of interest − CT value for GAPDH). All error bars indicate standard deviation (n = 3, #: p ≤ 0.05, unpaired two-tailed t-test).

