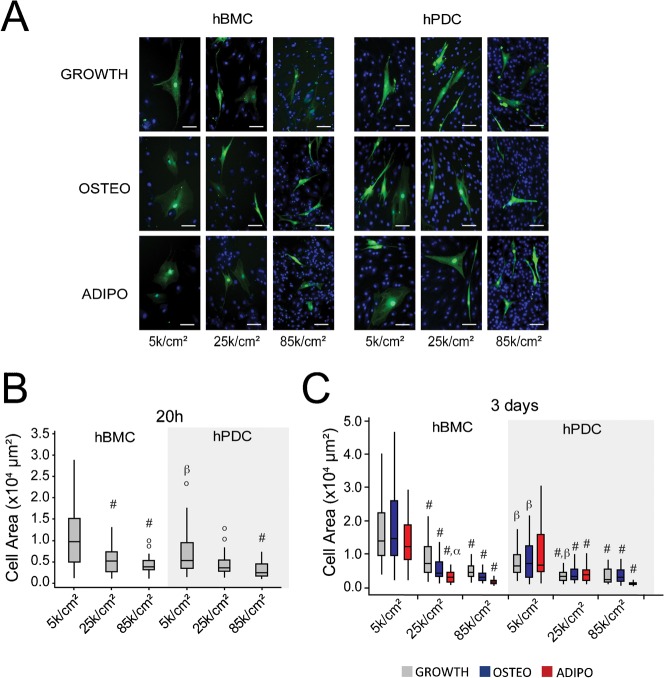
Fig. 4. Seeding density modulates cell shape in both cell types.
(A) Fluorescent microscopy images of GFP-labeled hBMCs and hPDCs mixed with unlabeled cells and seeded at different densities. Images are taken 3 days after seeding in presence of osteogenic (OSTEO) or adipogenic (ADIPO) differentiation medium for the last 2 days, or growth medium (GROWTH) for all 3 days (Green: GFP, Blue: DAPI counterstained nuclei, scale bar = 100 µm). (B) Quantification of cell spread area for GFP-labeled hPDCs and hBMCs at 20 hours after seeding (#: p ≤ 0.05, comparing to 5 k/cm2 condition; β: p ≤ 0.05, comparing to hBMCs seeded at the same density; o: outliers). (C) Quantification of cell spread area at 3 days after seeding (#: p ≤ 0.05, comparing to 5 k/cm2 condition in the same medium, α: p ≤ 0.05, comparing to the same seeding condition in growth medium, β: p ≤ 0.05, comparing to hBMCs under the same seeding/medium conditions. 30–60 cells were counted per condition. Statistical significance calculated by ANOVA and Tukey's post hoc test).

