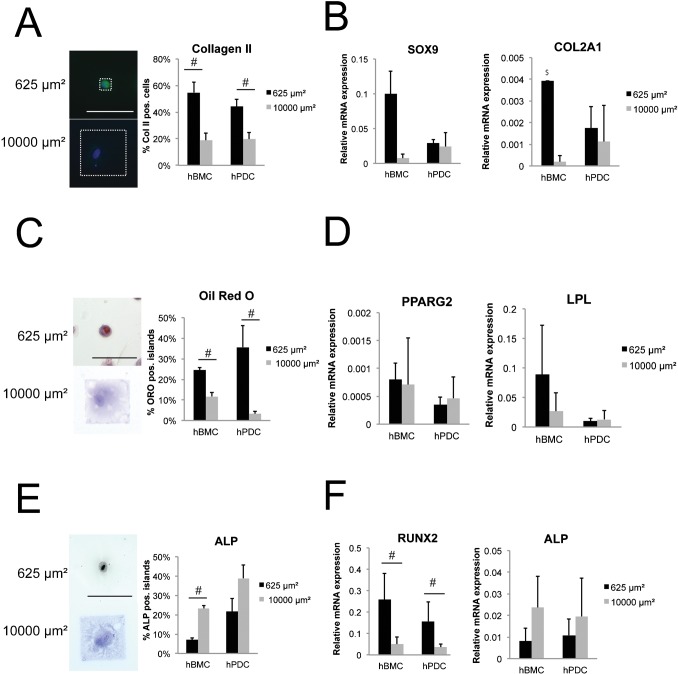
Fig. 5. Cell shape controls differentiation in hPDCs and hBMCs.
Chondrogenic (A,B), adipogenic (C,D), and osteogenic (E,F) differentiation of hBMCs and hPDCs patterned on 625 µm2 or 10000 µm2 fibronectin islands and cultured in the indicated medium for 2 weeks. A,C,E show representative cell images and quantification of cells staining positive for (A) collagen type II (green: Collagen II, blue: DAPI counterstaining), (C) Oil Red O (hematoxylin counterstaining), and (E) ALP. White dashed box in (A) outlines one 625 µm2 and one 10000 µm2 fibronectin pattern (scale bar = 100 µm). Gene expression of markers indicative for chondrogenesis (B, SOX9 and COL2A1), adipogenesis (D, PPARG2 and LPL), and osteogenesis (F, ALP and RUNX2), expressed relative to GAPDH. All error bars indicate standard error of the mean (n = 2 hBMC donors or 4 hPDC donors; n = 3–6 independent experiments per lineage; $: result obtained in only one experiment). (#: p ≤ 0.05, Mann-Whitney U test for A–E, unpaired two-tailed t-test for F).

