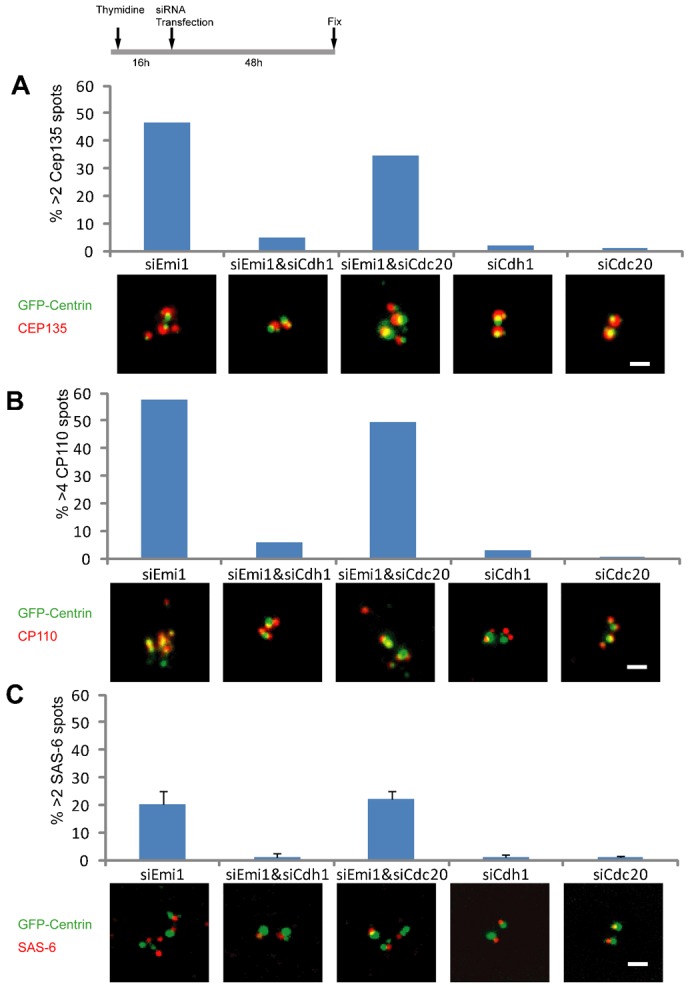
Fig. 2. After Emi1 knockdown in S phase, APC/C–Cdh1, not APC/C–cdc20, activity mediates centriole disengagement.

The experimental conditions are indicated in the protocol diagram at the top of the figure. (A) Incidence of cells with >2 Cep135 spots associated with centrin foci after transfection with the indicated constructs. Representative images of the Cep135 and GFP-centrin signals are shown for each experimental condition. (B) Incidence of cells with >4 CP110 spots associated with centrin foci after transfection with the indicated constructs. (C) Incidence of cells with >2 SAS-6 spots associated with centrin foci after transfection with the indicated constructs. Representative images for each condition are shown. Images are maximum intensity point projections from Z series images. Scale bars = 1 µm. In panels A and B histogram bars indicate the average from 2 experiments with >200 cells counted for each condition. In panel C histogram bars indicate the average from 3 experiments. Error bars are one standard deviation.
