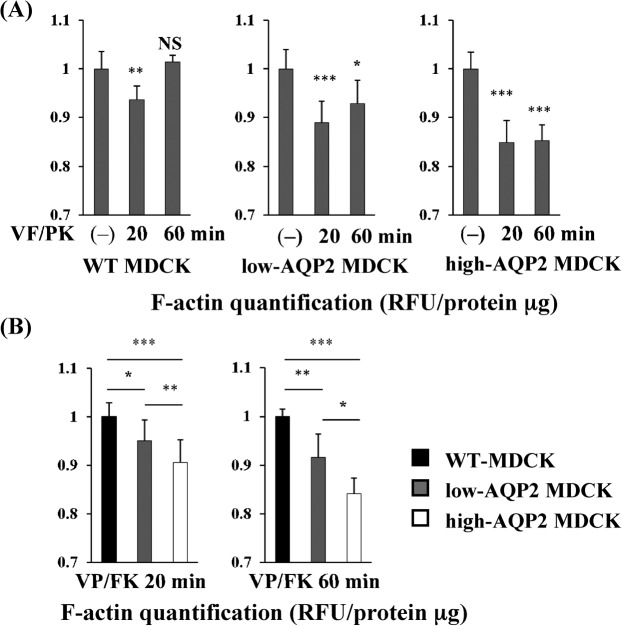
Fig. 3. VP/FK mediated F-actin depolymerization is correlated with AQP2 expression levels in MDCK cells.
(A) MDCK cells were treated with or without VP/FK (20 nM AVP and 50 µM FK) for indicated times, then F-actin was quantified using the F-actin quantification assay shown in Fig. 1. In higher AQP2 expressing cells (high-AQP2 MDCK, right panel), F-actin was significantly decreased by VP/FK at both 20 minutes and 60 minutes. (n = 5, *** P<0.001). In lower AQP2 expressing cells (low-AQP2 MDCK, center panel), F-actin was also significantly decreased, but to a lesser extent, by VP/FK at both 20 minutes and 60 minutes. (n = 5, * P<0.05, *** P<0.001). In WT MDCK cells, F-actin was slightly but significantly decreased by VP/FK at 20 minutes, but was not decreased at 60 minutes. (n = 5, ** P<0.01, NS = not significant). These figures are representative of three independent experiments. (B) F-actin content in each MDCK cell line at the same VP/FK time points was compared using data from Fig. 3A. At both 20 minutes and 60 minutes, higher AQP2 expression is associated with a lower F-actin content (n = 5, * P<0.05, ** P<0.01, *** P<0.001). These figures are representative of three independent experiments.

