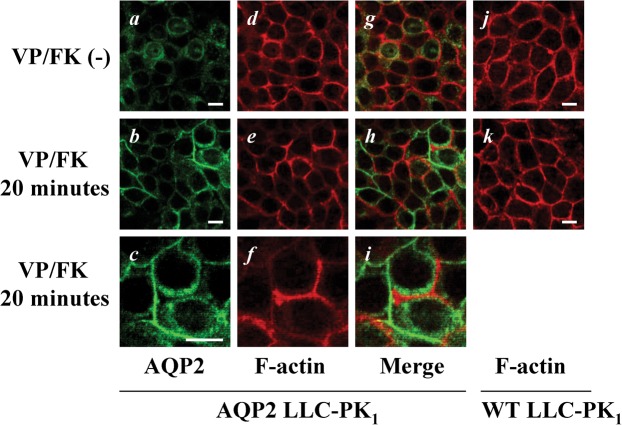
Fig. 6. AQP2 membrane accumulation and F-actin membrane localization are inversely related in LLC-PK1-AQP2 cells.
LLC-PK1 cells were stained with AQP2 antibody (green) and rhodamine phalloidin (red) with or without VP/FK treatment (LVP 20 nM and FK 10 µM for 20 minutes). AQP2 was located intracellularly (panels a, g) with well defined basolateral cortical F-actin under non-stimulated conditions (panels d, g). After VP/FK treatment, AQP2 accumulated in lateral plasma membranes (panels b, c) where F-actin depolymerization was clearly detectable in a heterogeneous pattern (panels e, f). There was a clear inverse relationship between the intensity of F-actin staining and AQP2 membrane accumulation (panels b, e, and h). This inverse relationship between AQP2 and F-actin after VP/FK treatment is more clearly appreciated at high magnification (panels c, f, and i). The VP/FK-mediated (same concentration and incubation time) selective decrease of F-actin signal was not observed in untransfected LLC-PK1 cells (panels j, k). The images are representative of three independent experiments. Scale bars, 10 µm.

