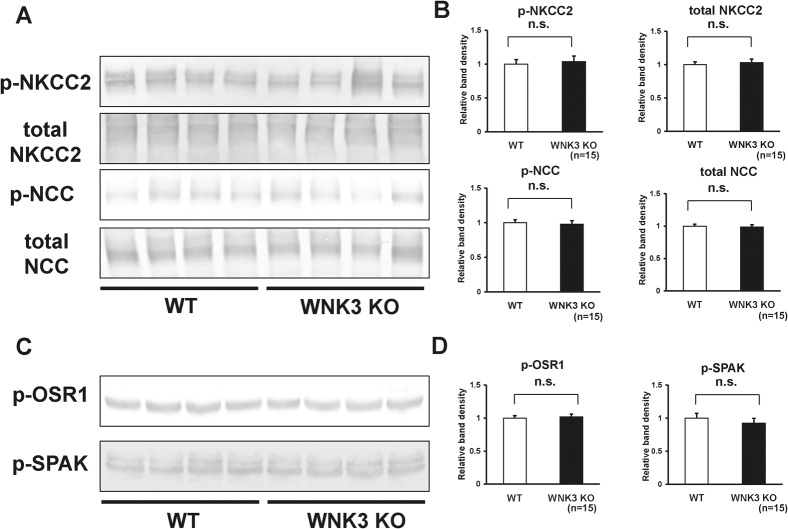
Fig. 5. Expression and phosphorylation of NKCC2 and NCC in kidneys from WNK3 knockout mice under normal diet.
(A) Representative immunoblots of total- and phosphorylated- NKCC2 and NCC in kidneys from wild-type and WNK3 knockout mice. (B) Densitometry analyses of expression and phosphorylation of NKCC2 and NCC in kidney from wild-type and WNK3 knockout mice. For densitometry analysis, values (n = 15) are expressed as ratios against the average of signals in the wild-type group. There were no significant decreases in the expression and phosphorylation of NKCC2 and NCC in kidneys from WNK3 knockout mice, as compared to wild-type littermates. (C) Representative immunoblots of p-OSR1 and p-SPAK in kidneys from wild-type and WNK3 knockout mice. (D) Densitometry analyses of p-OSR1 and p-SPAK in kidneys from wild-type and WNK3 knockout mice. For densitometry analysis, values (n = 15) are expressed as ratios against the average of signals in the wild-type group. There were no significant decreases in phosphorylation of OSR1 and SPAK in kidneys from WNK3 knockout mice, as compared to wild-type littermates. n.s. not significant.

