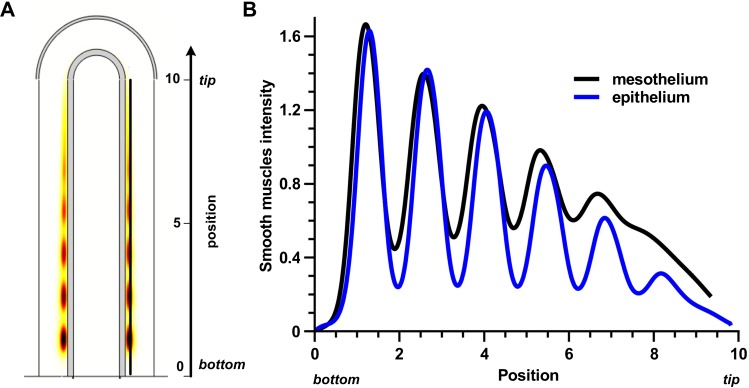
Fig. 4. Similar smooth muscle profile when FGF9 is produced in the mesothelium or the epithelium.
(A) Distribution of smooth muscles at τ = 120 with FGF9 produced in the mesothelium. (B) Smooth muscles intensity at τ = 120 in the stalk. Position 0 is the bottom, position 10 the tip of the stalk. Production rates are adjusted for the two production sites ( , and
, and  ) in order to have the same maximal smooth muscles intensity. All parameters are as in Table 1 unless otherwise stated.

