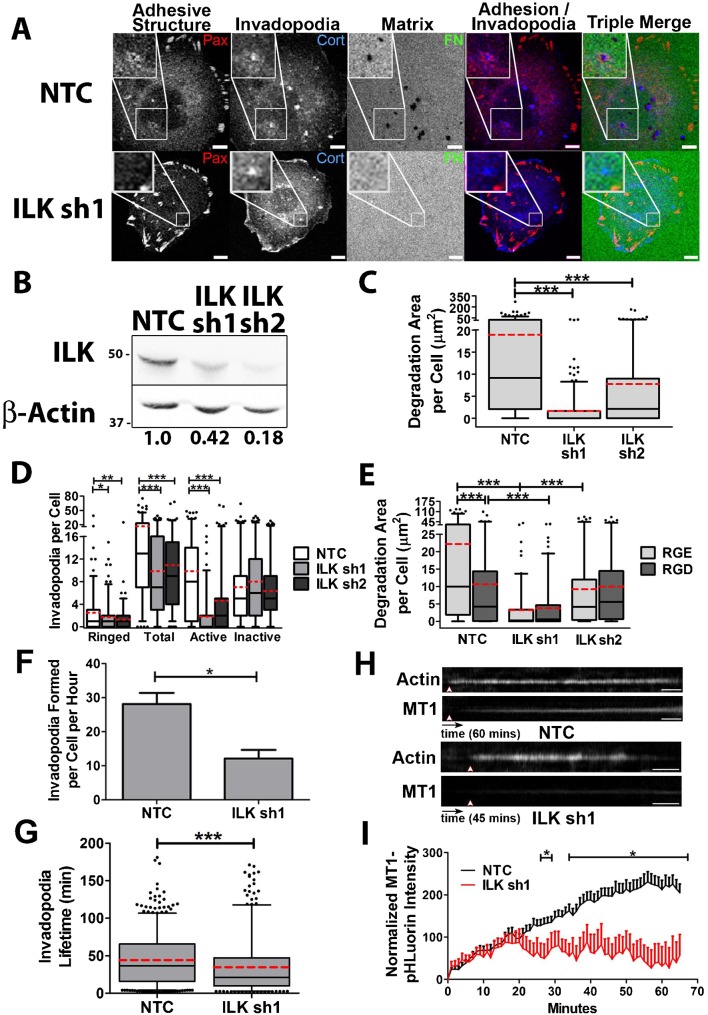
Fig. 4. Integrin-linked kinase controls adhesion ring formation, invadopodium dynamics and activity.
(A–E) SCC61 cells stably expressing shRNA against ILK1 (sh1, sh2) or non-targeting control (NTC) shRNA were cultured on FITC-FN/1% gelatin for 16 hours. (A) Confocal images. Scale bars = 5 µm. (B) Western blot for ILK in total cell lysates from SCC61 cells. Numbers indicate ILK band intensity of the indicated cell line as a ratio of the NTC ILK level, after normalization to the β-actin loading control. (C) Degradation area per cell. (D) Invadopodium characteristics. (E) NTC and ILK-KD cells were further treated with RGE or RGD peptides and analyzed for degradation. Note that there is only a significant difference within a cell line for NTC. n≥60 cells per condition from ≥3 independent experiments. (F–I) Live-cell imaging of NTC or ILK sh1 SCC61 cells expressing Tom-Tractin, to mark invadopodia, and MT1-MMP-pHLuorin (MT1), to mark extracellular MT1-MMP was performed and analyzed for (F) invadopodium formation rate, (G) Invadopodium lifetime, (H,I) MT1 accumulation over time at invadopodia. Time scale bars = 5 minutes. n≥11 cells, ≥300 invadopodia per condition from ≥3 independent experiments. Error bars on invadopodium formation graphs indicate SEM. For C,D,E,G, box and whiskers show respectively the 25–75th and 5–95th percentiles with the dotted red line indicating the mean and the black line indicating the median. *P<0.05; **P<0.01, ***P<0.001.

