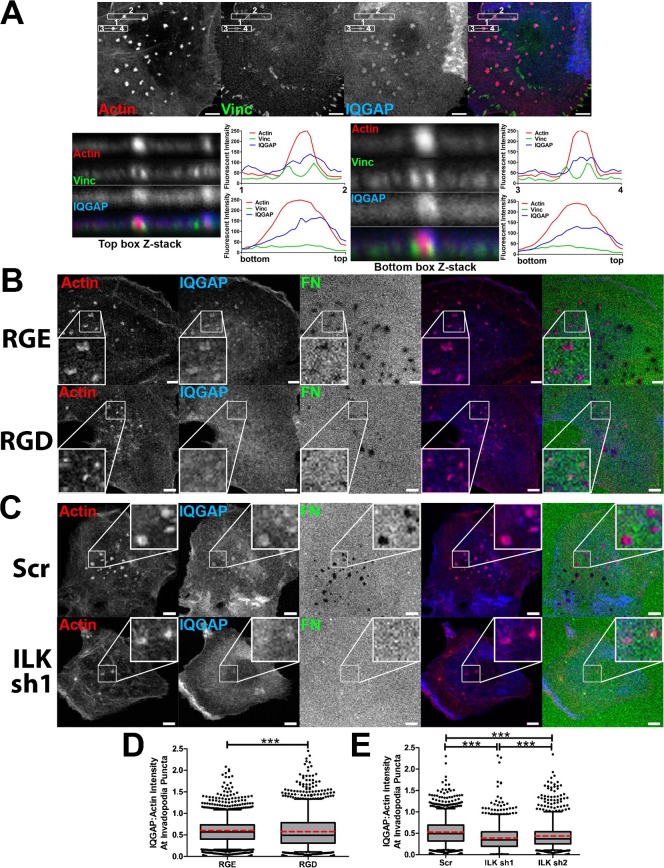
Fig. 5. Localization of IQGAP to invadopodia is dependent on integrins and ILK.
(A) Confocal images of SCC61 cells cultured on unlabeled-FN/1% gelatin for 16 hours and immunostained for actin (red), IQGAP (blue) and vinculin (Vinc, green). Confocal Z-stacks of boxed invadopodia are shown. Graphs indicate fluorescent intensity (in arbitrary units) of each marker over the indicated line scan in the X-Y or X-Z dimensions. (B–E) SCC61 cells treated with RGD or control RGE peptide (250 µg/ml) (B,D) or stably expressing shRNA against ILK1 (sh1, sh2) or non-targeting control (NTC) shRNA (C,E) were cultured on FITC-FN/1% gelatin (FN, green) for 16 hours then immunostained for actin (red) and IQGAP (blue). (B,C) Confocal images. Zooms indicate typical invadopodia for condition. (D,E) Ratio of IQGAP to actin intensity at invadopodia. Box and whiskers show respectively the 25–75th and 5–95th percentiles with the dotted red line indicating the mean and the black line indicating the median. ***P<0.001. Scale bars = 5 µm.

