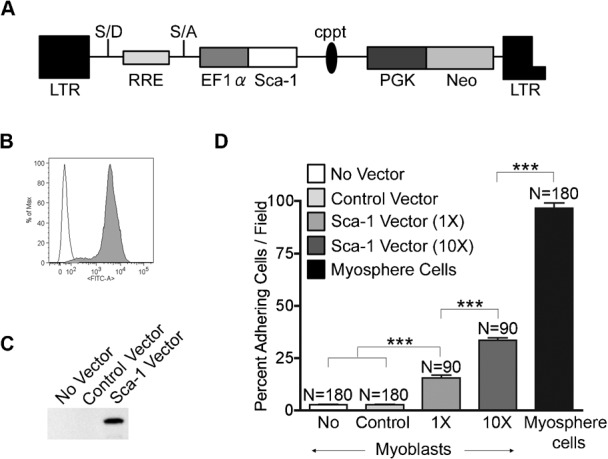
Fig. 6. Sca-1 expression in myoblasts increases adhesion to αVβ3 integrin.

(A) Bicistronic lentiviral vector used to transduce primary myoblasts. (B) FACS profile showing Sca-1 expression by transduced myoblasts. Empty peak represents the unstained control, filled peak myoblasts incubated with FITC conjugated Sca-1 antibody. (C) Western showing the expression of Sca-1 in untransduced, control transduced, and Sca-1 transduced myoblasts. (D) Graph showing the percent of cells adhering/field to αVβ3 integrin versus cells tested, represented are myoblasts (white), myoblasts transduced by the control vector (light gray), myoblasts transduced by the Sca-1 vector (medium gray, MOI = 5) and (dark gray, MOI = 50), and myosphere cells (black). Results were pooled from 6 independent adhesion assays (3 for cell transduced at an MOI = 5, and 3 for those transduced at a MOI = 50). Error bars display ± s.e.m. ***P<0.0001 by unpaired Student's t test.
