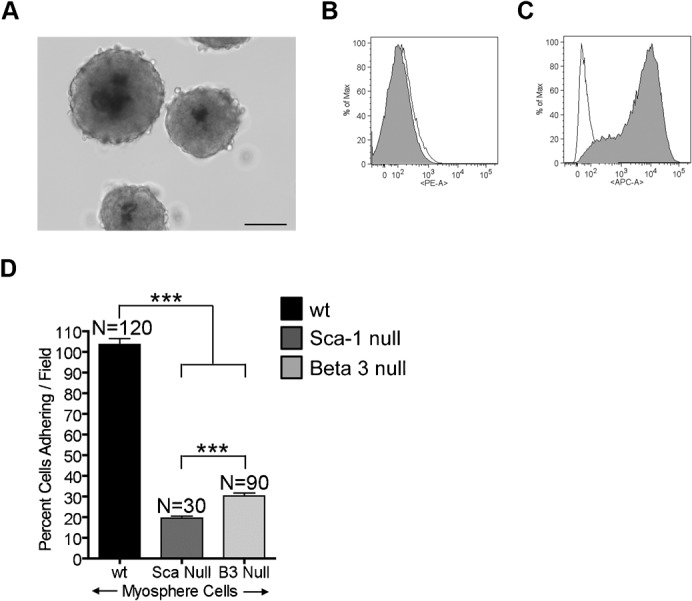
Fig. 8. Growth and adhesion of β3 null myospheres.

(A) Myospheres generated from β3 integrin null mice. FACS profiles showing the expression of (B) β3 integrin and (C) Sca-1 by β3 null myospheres. Empty peaks represent the unstained controls; filled peaks represents cells incubated with PE conjugated to β3 integrin antibody and APC conjugated to Sca-1 antibody, respectively. (D) Graph showing the percent of cells adhering/field to αVβ3 integrin versus cells tested; represented are myosphere cells isolated from wild type (black), Sca-1 null (dark gray), and β3 integrin null (light gray) mice. These results were pooled from 2 independent experiments. Error bars display ± s.e.m. ***P<0.0001 by unpaired Student's t test. Measure bar shown in A represents 100 µm.
