
Fig. 4. Expression of skeletogenesis genes after crush injury.
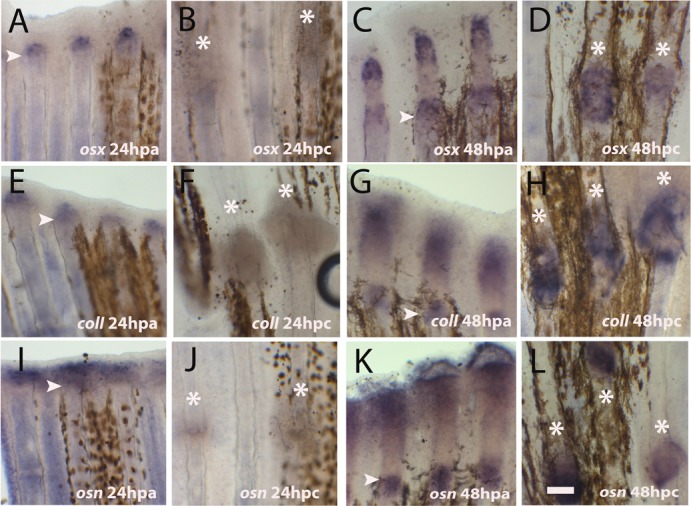
(A–L) Whole mount in situ hybridization for mRNA detection of (A–D) osterix at (A) 24 hpa; (B) 24 hpc (C) 48 hpa (D) 48 hpc; (E–H) collagen I at (E) 24 hpa (F) 24 dpc (G) 48 hpa (H) 48 hpc; (I–L) osteonectin at (I) 24 hpa (J) 24 hpc (K) 48 hpa (L) 48 hpc. Arrowheads indicate the amputation plane and asterisks indicate crush injury sites. Scale bar corresponds to 100 µm in all panels. (hpa – hours post-amputation; hpc – hours post-crush injury).