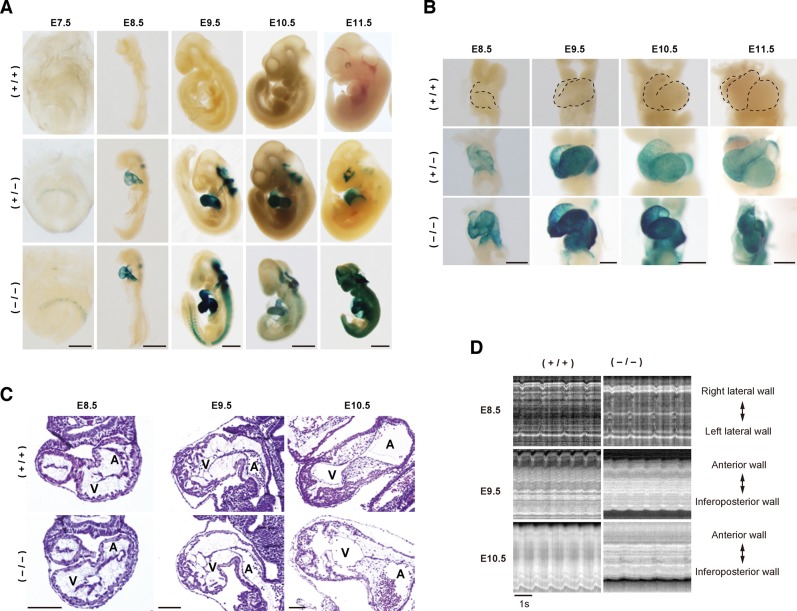
Fig. 2. Cardiac development in Fhod3−/− embryos at E9.5–11.5.
(A) Whole-mount lacZ staining of Fhod3+/+ (+/+), Fhod3+/− (+/−), and Fhod3−/− (−/−) embryos at E7.5–11.5. Bars: (E7.5) 250 µm; (E8.5/E9.5) 500 µm; (E10.5/E11.5) 1 mm. (B) Looping of the heart tube between E8.5 and E11.5 (front view). Bars: (E8.5/E9.5) 250 µm; (E10.5/E11.5) 500 µm. The contour of the wild-type heart is indicated by dotted lines. (C) Histological analysis of embryonic hearts between E8.5 and E10.5. Transverse sections (E8.5) and longitudinal sections (E9.5/E10.5) of hearts were stained with hematoxylin and eosin. Bars, 100 µm. (D) Kymographic analysis of beating of embryonic hearts between E8.5 and E10.5. The kymographs were generated from supplementary material Movies 1–6, and oriented so that the right lateral and left lateral walls are upward and downward, respectively (E8.5), or the anterior and inferoposterior walls are upward and downward, respectively (E9.5 and E10.5).

