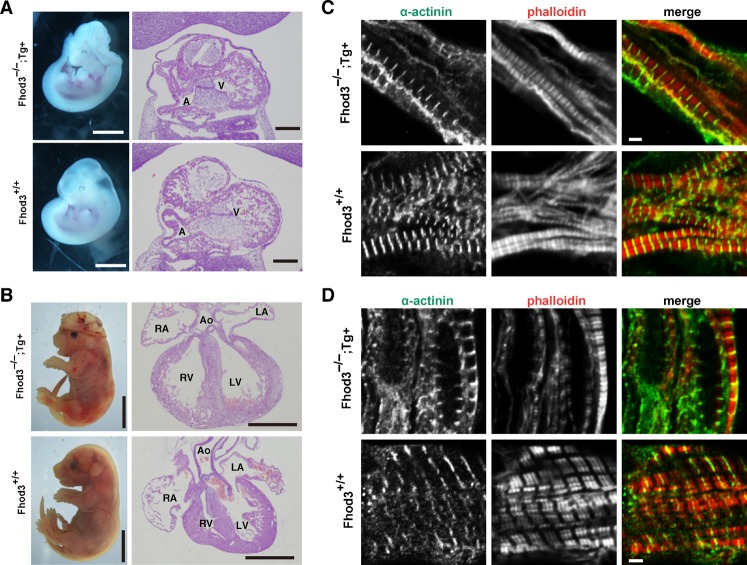
Fig. 4. Effect of transgenic expression of Fhod3 in the heart of Fhod3−/− mice.
(A,B) Whole-mount (left panels) and histological (right panels) analyses of wild-type (Fhod3+/+) and Fhod3−/−Tg(α-MHC-Fhod3) (Fhod3−/−;Tg+) embryos at E11.5 (A) and E17.5 (B). V, ventricle; A, atrium; LV, left ventricle; RV, right ventricle; LA, left atrium; RA, right atrium; Ao, aorta. Bars in A: (left) 1 mm; (right) 200 µm. Bars in B: (left) 5 mm; (right) 1 mm. (C,D) Confocal fluorescence micrographs of hearts of wild-type (+/+) and Fhod3−/−Tg(α-MHC-Fhod3) (Fhod3−/−;Tg+) embryos at E10.0 (C) and E17.5 (D). Sections of embryonic hearts were subjected to immunofluorescent staining for α-actinin (green) and phalloidin staining for F-actin (red). Bars, 2 µm.

