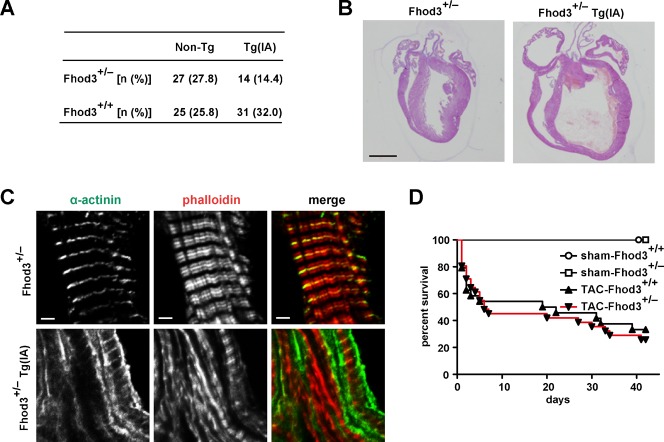
Fig. 5. Transgenic expression of Fhod3 (I1127A) in the heart.
(A) Genotypes of offspring from the mating of Fhod3+/− × Fhod3+/+Tg(α-MHC-Fhod3IA). The number in parentheses indicates the percentage of the total number of offspring. (B) Histological analysis of hearts from Fhod3+/− and Fhod3+/−Tg(α-MHC-Fhod3IA) (Fhod3+/−Tg(IA)) mice at age of 8 day. Bars, 100 µm. (C) Confocal fluorescence micrographs of hearts from Fhod3+/− and Fhod3+/−Tg(α-MHC-Fhod3IA) (Fhod3+/−Tg(IA)) mice at P8. Sections of hearts were subjected to immunofluorescent staining for α-actinin (green) and phalloidin staining for F-actin (red). Bars, 2 µm. (D) Kaplan-Meier survival curves versus days after TAC. TAC-Fhod3+/+ (n = 24); TAC-Fhod3+/− (n = 31); sham-Fhod3+/+ (n = 4); and sham-Fhod3+/− (n = 4) mice.

