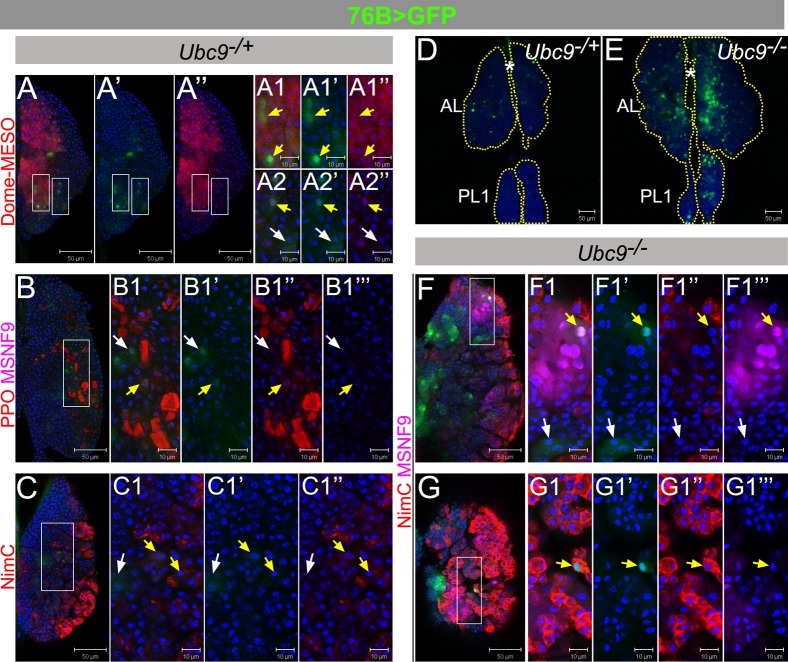
Fig. 2. 76B-Gal4 characterization in control and Ubc9 lymph glands.
(A–C1″) L3 (6-day) Ubc9−/+ anterior lobes expressing 76B>GFP (green), co-labeled with Dome-MESO (red; A–A2″), or Pro-Phenol Oxidase and misshapen (PPO, red, and MSNF9, magenta, respectively; B–B1‴), or Nimrod C (NimC, red; C–C1″). (D–E) 76B>GFP (green) expression in 6-day Ubc9−/+ (D) and Ubc9−/−(E) lymph glands. (F–G1‴) L3 (6-day) Ubc9−/− anterior lobes expressing 76B>GFP (green), labeled with Nimrod C and misshapen (NimC, red and MSNF9, magenta, respectively); presented are lower (F–F1‴) and upper (G–G1‴) optical sections of two lymph glands. Split-channel images show green (′), red (″) or magenta (‴). Selected regions (white rectangles) are shown as high magnifications (panels labeled with numbers 1–2). White arrows – cells expressing singly 76B>GFP, and yellow arrows – two markers; star–DV. Confocal sections (A–G1‴). Scale bars: 50 µm (A–A″,B,C,D,E,F,G) and 10 µm (remaining panels).

