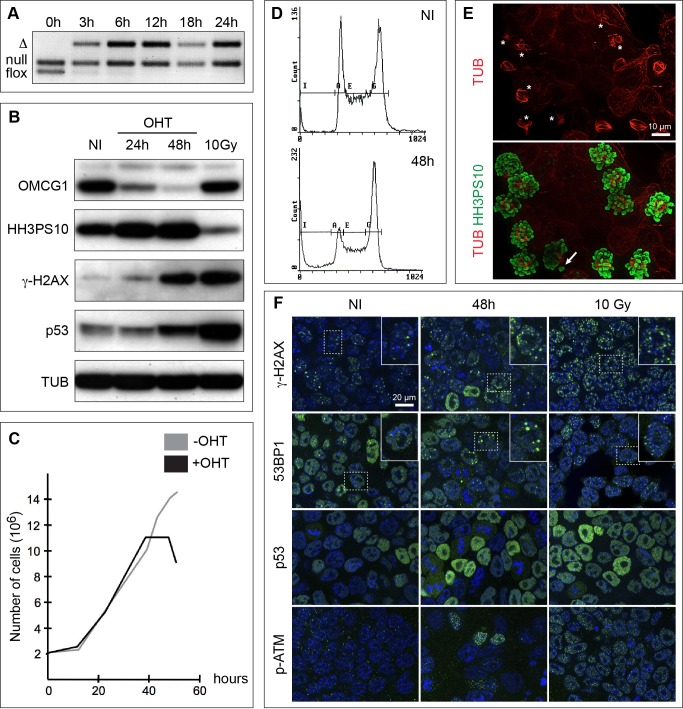
Fig. 6. Abnormal mitotic progression in ES cells lacking OMCG1.
PCR (A) and Western blot (B) analyses of non-induced (NI) and induced Omcg1flox/null;Rosa26CreERT2/+ ES cells cultured for different time points after 4-OHT addition. Proliferation curves (C) and cell cycle profiles (D) of non-induced and induced ES cells. (E) Highly disorganized mitotic spindles (stars) and misaligned chromosomes (arrow) in mutant cells 48h after induction. (F) Immunofluorescence staining of ES cells either non-induced or 48 hours after induction for markers of DSB and DDR (green). Cells were counterstained with Hoechst 33342 (blue). ES cells 1 hour after 10 Gy of irradiation were included as control for Western blot and immunofluorescence analyses.

