
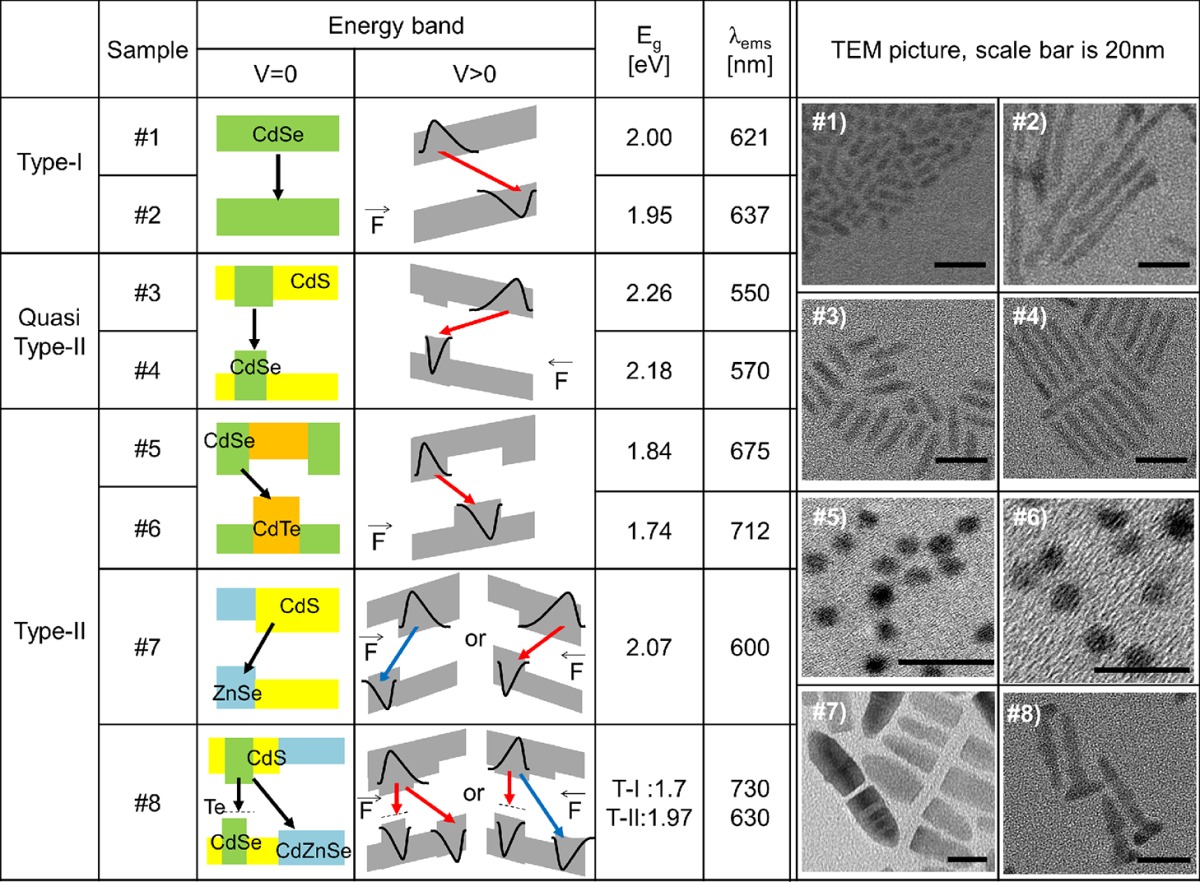
Table 1. List of Studied Samples and Their Relevant Attributesa.
a
Eg and λems are the respective NP’s optical band gap and peak emission wavelength. Black arrow represents a radiative recombination pathway without electric field (F). When F is applied, λems is either increased (red arrow) or decreased (blue arrow) depending on the NPs’ composition and its relative orientation with respect to the direction of F. Transmission electron microscopy (TEM) micrographs of all samples are shown on the right panel.