
Figure 5.
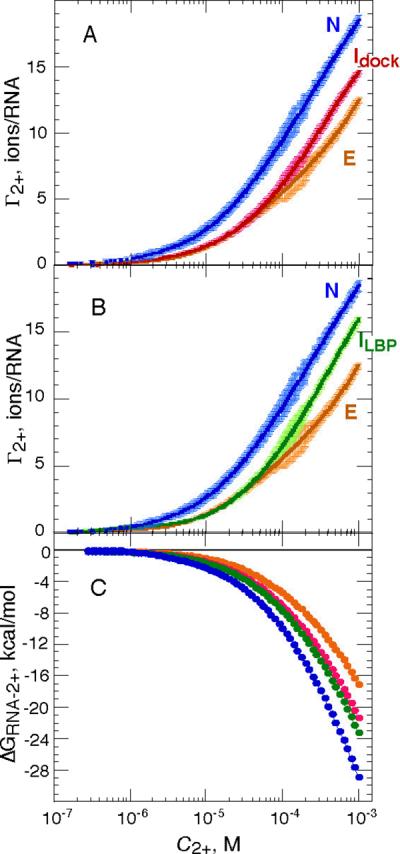
Excess Mg2+ (Γ2+) as a function of bulk Mg2+ concentration (C2+) for wild type and C60G RNAs in standard conditions (50 mM K+, 20 °C), with and without the ligand DAP present (250 μM). Six or seven independent data sets were merged to obtain each titration curve; errors are shown in the plots as lighter color bars (see Materials and Methods). A, wild type RNA in the presence (blue) or absence (magenta) of ligand. C60G RNA in the absence of ligand is shown for comparison (orange). B, C60G RNA in the presence (green) or absence (orange) of ligand. Wild type RNA in the presence of ligand is shown for comparison (blue). C, Free energies of Mg2+-RNA interaction (ΔGRNA-2+) calculated from Γ2+ curves in panels A and B (see Materials and Methods). Blue, native RNA (N); orange, C60G RNA in the absence of ligand (E); green, the Idock conformation, extrapolated from wild type RNA at 1 mM Mg2+; magenta, ILBP conformation, extrapolated from C60G RNA bound to ligand at 1 mM Mg2+.