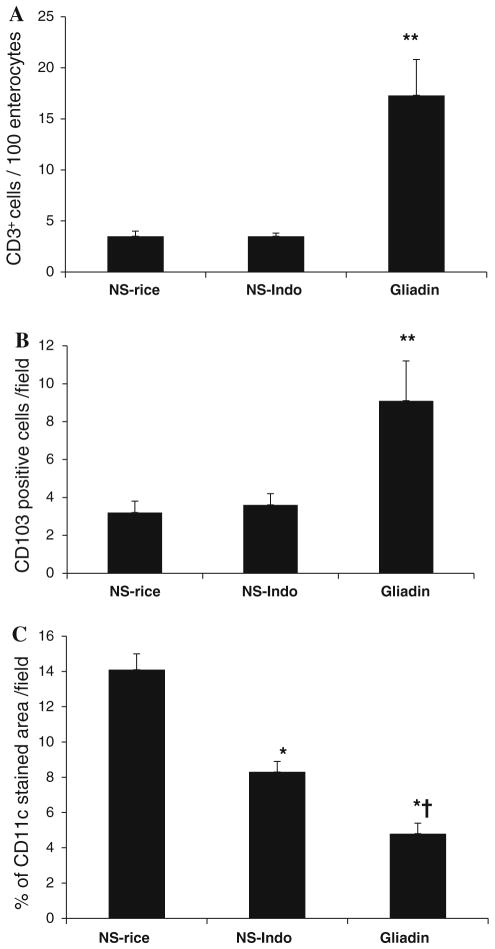
Fig. 3.
Quantification of CD3, CD103, and CD11c immunostainings performed in small intestinal samples from HCD4/HLA-DQ8 transgenic mice. We studied non-sensitized mice orally challenged with rice cereal (NS-rice, n = 9) or indomethacin (NS-Indo, n = 5) as well as animals sensitized and orally challenged with gliadin (Gliadin, n = 7). Black bars represent number of CD3+ lymphocytes/100 enterocytes (a); number of CD103+ cells/field (b); and percentage of CD11c stained area/field (c). Values are mean ± SEM; **p < 0.05 versus NS-rice and NS-Indo; *p < 0.001 versus NS-rice; and †p < 0.01 versus NS-Indo

