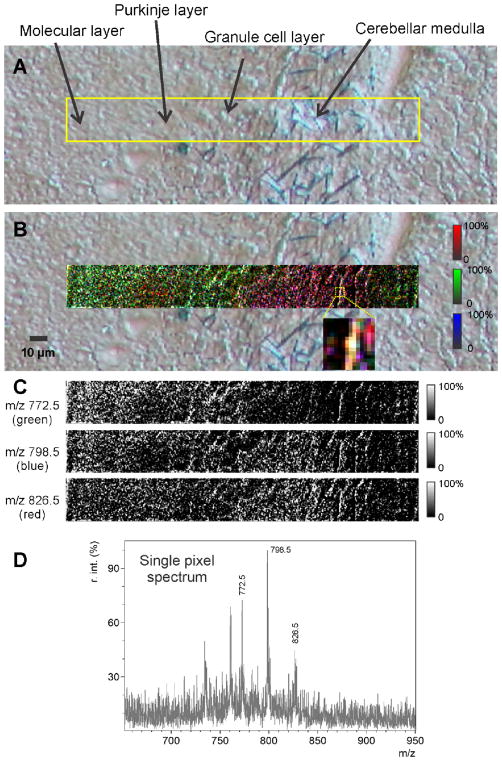
Figure 5.
A – Optical microscope DIC image of a mouse cerebellum original tissue. Yellow rectangle – area of the MS image. B - MALDI TOF MS lipid image at 500 nm raster by 1 μm laser beam. Image is overlaid with optical microscope DIC image. MS image is an RGB mix of 3 MS images: m/z 772.5 – green, m/z 798.5 – blue, and m/z 826.5 – red, shown separately in panel C. D - mass spectrum, acquired from a single pixel, where all 3 imaged ions are present

